Indicator: Population-weighted particulate matter exposure (PM10)
 Click to enlarge
Source: German Environment Agency Figure as PDF
Click to enlarge
- Population-weighted particulate matter (PM10) levels in Germany were significantly lower in 2021 than in 2010.
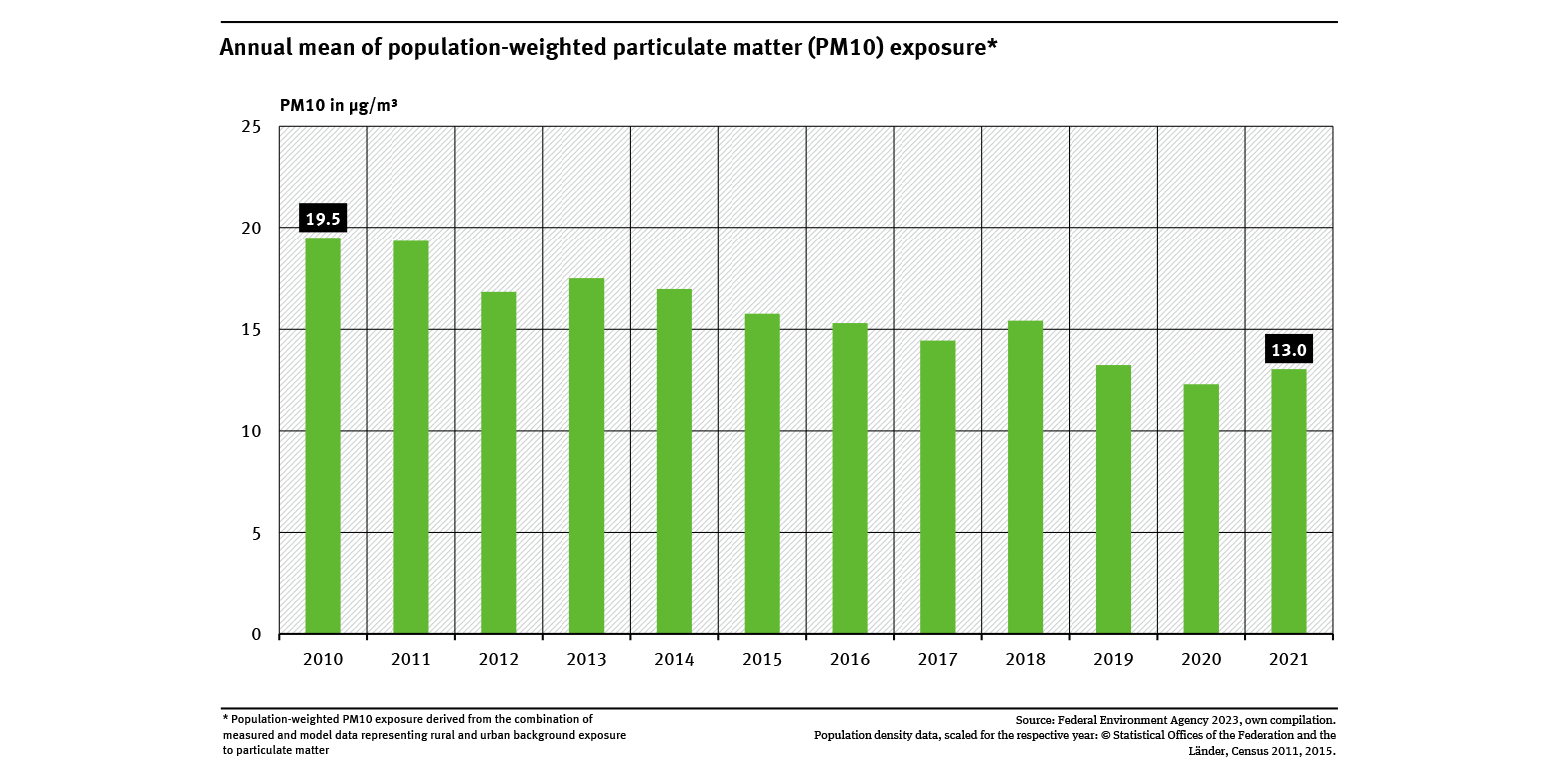
- In 2021, the population-weighted particulate matter exposure was 13.0 micrograms per cubic meter on average for the year. This is 33 % less than in 2010.
- The decrease in exposure is due to declining emissions from stationary sources (e.g., power plants, waste incineration plants, domestic firing and industrial plants.) and measures taken in the transportation sector.
For the assessment of health risks due to particulate matter, it is necessary to record the population's exposure in Germany and to evaluate it with regard to potential health consequences. Accordingly, the present indicator is a measure of the average population-weighted particulate matter exposure per year in Germany (measured in micrograms per cubic meter, µg/m³). It refers to particulate matter in outdoor air with a diameter smaller than 10 micrometres (PM10). With continuous recording of the indicator, trends over time can be derived for the average exposure of the total population for Germany.
Over the period considered, we can see that the particulate matter exposure indicated by the indicator has shown a downward trend: In 2010, the indicator value was 19.5 micrograms per cubic meter (µg/m³). In 2021, however, the value was 13.0 µg/m³. This corresponds to a reduction of around 33 %.
The emerging decrease in PM10 levels is mainly due to reduction measures for emissions from stationary sources (power plants, waste incineration plants, domestic firing and industrial plants) as well as measures in the transport sector. Furthermore, variable weather conditions have a direct influence on air pollution with particulate matter. In isolated years, this can lead to a decrease or an increase in particulate matter pollution and thus superimpose temporal changes in emissions (see “Air Quality 2022”, UBA 2023).
For the indicator, model data of the chemical transport model REM-CALGRID are combined with PM10 measurement data of the immission measurement networks of the federal states and the UBA and transferred to the entire area of Germany. This is done at a spatial resolution of 2 km x 2 km. The PM10 data are then combined with information on the spatial distribution of population density. For the calculation of the indicator, the particulate matter concentrations per grid cell are then multiplied by the respective number of the assigned population, summed up in total and subsequently divided by the sum of the total population of Germany.
Here, only the monitoring stations in the rural and urban background are considered for the calculation of the indicator. Therefore, it can be assumed that the approach used here tends to underestimate the pollution situation.
The UBA’s motto, For our environment (“Für Mensch und Umwelt”), sums up our mission pretty well, we feel. In this video we give an insight into our work.