Surface water quality was considerably improved in recent decades in Germany. Nevertheless, hazardous substances are still emitted into surface waters. Reducing emissions is mandatory. Where do the pollutants originate? Where are emission hotspots? Which measures are efficient? In order to answer these questions, integrated modelling tools have to be applied.
Pollutant emissions into surface waters - necessary information for policy makers
Information on substance emissions into surface waters is basically needed for planning measures, e.g. for implementing the EU Water Framework Directive and the EU Marine Strategy Framework Directive. Furthermore, this information is necessary to reduce substance emissions into marine waters efficiently according to the international agreements for the protection of the Baltic and North Seas (HELCOM - Helsinki Commission, OSPAR - Oslo-Paris Commission).
Marine waters are the sinks for many substances transported in rivers. To protect the marine environment, the EU has established targets for nutrients and some pollutants according to the Marine Strategy Framework Directive (MSFD, 2008/56/EC) Germany has committed to reducing riverine inputs further. This requires an integrated analysis of all upstream waters and its polluters, which is not possible with monitoring data alone.
In order to initiate effective measures to achieve the goals of WFD, MSFD, HELCOM and OSPAR the sources of the substances, their use, their transport pathways and finally the emission into surface waters needs to be known.
Pollutant emissions – nationwide quantification
UBA uses the regionalized pathway analysis for the Germany-wide quantification of pollutant emissions into surface waters. It provides information on the most important emission pathways (Figure 1). The substance emission results are temporally and spatially differentiated. This complex approach requires a large amount of information and input data. As a result, it is possible to identify the most relevant emission pathways for implementing measures on a supra-regional level. UBA uses the pathway-oriented emission model MoRE (Modelling of Regionalized Emissions).
Figure 1. Overview on the basics of the regionalized pathway analysis approach
and the emission pathways of the MoRE model, respectively.
Source: KIT / IWG
The MoRE Model
MoRE was developed as an open source tool on behalf of UBA. It is methodically based on the model concept MONERIS (Modelling Nutrient Emissions in River Systems).
The model includes point source discharges and diffuse emission pathways. Point sources are:
industrial dischargers with in-house treatment plants
historical mining sites (considered only for metals).
Information on nutrient emissions from urban wastewater treatment plants with a size of more than 2,000 population equivalents (p.e.) is provided from reporting in accordance with the EU Urban Wastewater Directive (UWWTD, 91/271/EC). Results of a Germany-wide wastewater treatment plant monitoring project can be used to calculate emissions of selected pollutants. Information on large wastewater treatment plants (greater than 100,000 p.e.) and on industrial facilities is available from E-PRTR reporting (Pollutant Release and Transfer Register; EC PRTR Regulation 166/2006). Information on old mining sites was provided by the German federal states (Länder).
Diffuse pathways are:
groundwater discharge,
surface run off (alluviation),
soil loss due to water erosion and sediment transport into surface waters,
tile drainage,
urban areas (combined sewer overflows, storm water outlets and individual households not connected to sewers),
direct atmospheric deposition onto surface waters and
inland navigation.
A large amount of information (data) is required to quantify diffuse pollutant emissions. Examples are:
data on atmospheric deposition to estimate emissions directly onto surface waters (e.g. metal deposition) and
soil data to quantify soil loss and the amount of sediment transported to surface waters.
Pollutant emissions – results (Germany)
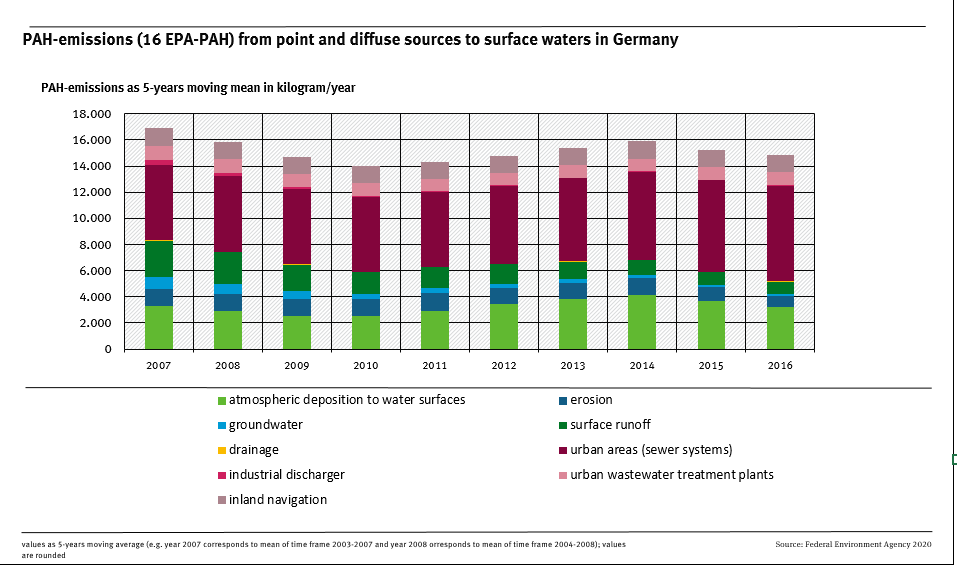
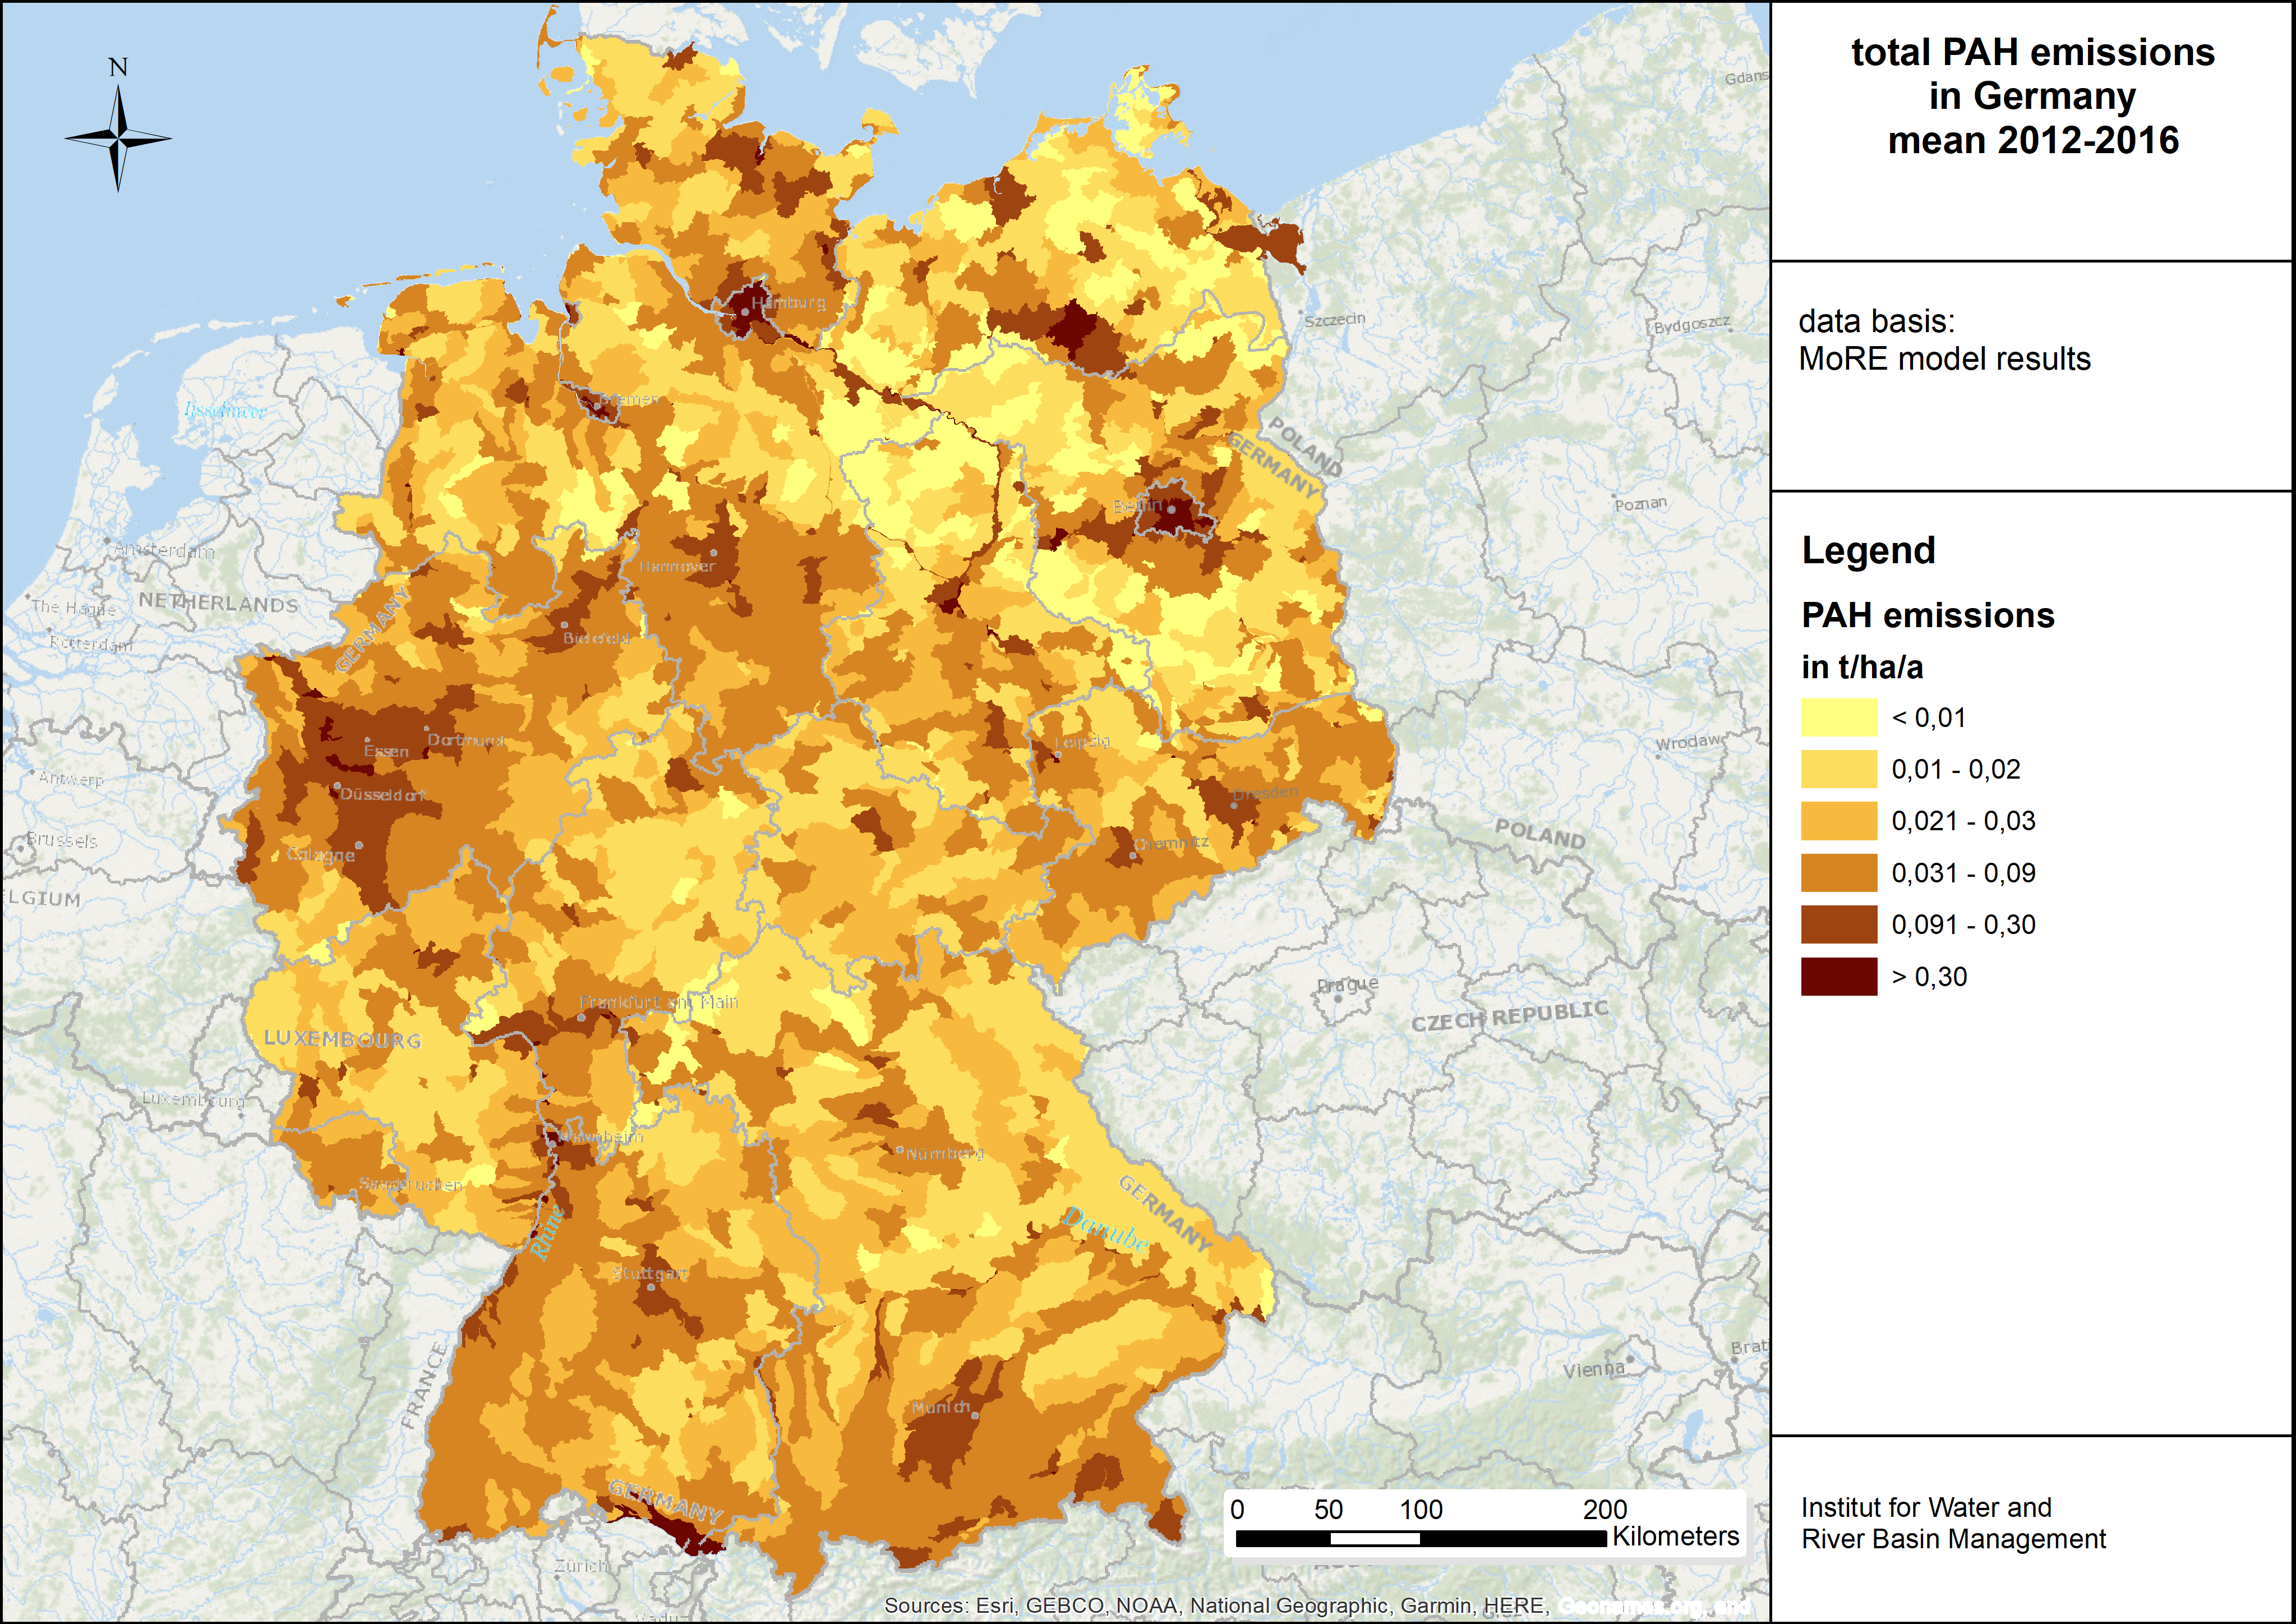
For Germany, pathway specific emission values are available in a continuous time series since 1983 for the nutrients nitrogen and phosphorus and the metals lead, cadmium, chromium, copper, nickel, mercury and zinc. For polycyclic aromatic hydrocarbons (PAH) results are available since 2003. The most relevant emission pathways can be identified for specific substances (see: Einträge von Nähr- und Schadstoffen). Figure 2 shows results for EPA PAHs (sum of the 16 PAHs listed by the US Environmental Protection Agency (EPA)). The main sources of PAHs are combustion processes. PAHs are emitted into the atmosphere and the subsequent deposition brings the PAH back to surfaces, where it is washed off e.g.by surface runoff from impervious urban areas. The dominance of the input pathways “direct atmospheric deposition onto surface waters” and “emissions from urban areas” (combined sewer overflows, storm water outlets) reflect these principal emission process (Figure 2). For PAH these pathways have the highest reduction potential. The spatial distribution of emission hotspots enables the identification of effective measures (Figure 3). Higher PAH emissions occur, among others, in densely populated areas and areas with a high proportion of surface waters.
Model results are also available for other substances, such as the plasticizer DEHP, the pesticides isoproturon and diuron, the chemical nonylphenol or single pharmaceutical substances (see also UBA publications: and Measures to reduce micropollutant emissions to water - Summary).
Figure 2: Pathway specific emissions of polycyclic aromatic hydrocarbons
(here sum of the 16 PAHs of the US Environmental Protection Agency (EPA)) into surface waters in Germany (2003 to 2016); shown as 5-year moving averages
Source: UBA
Figure 3: Spatial distribution of the area-specific emissions of polycyclic aromatic hydrocarbons
(here sum of the 16 EPA PAHs) into surface waters in Germany (average value 2012 to 2016)
The UBA’s motto, For our environment (“Für Mensch und Umwelt”), sums up our mission pretty well, we feel. In this video we give an insight into our work.
The UBA
Contact
Wörlitzer Platz 1 06844 Dessau-Roßlau GermanyPlease contact us exclusively by e-mail: buergerservice [at] uba [dot] de. Unfortunately, we are currently not available by telephone. There may currently be delays in answering enquiries. We ask for your understanding.
 Click to enlarge