Indicator: Air quality in agglomerations
 Click to enlarge
Source: German Environment Agency Figure as PDF
Click to enlarge
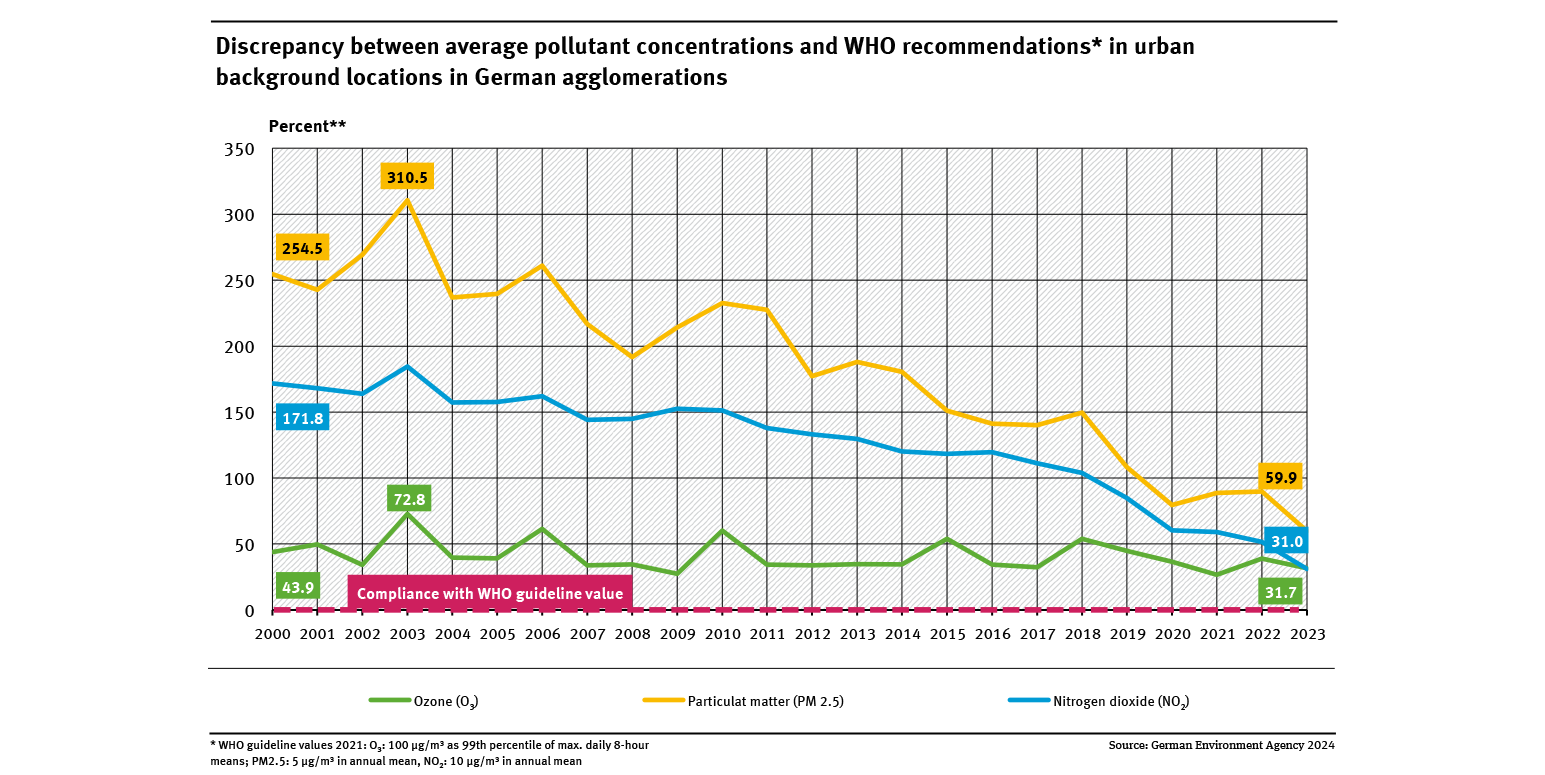
- The basic pollution levels in German conurbations significantly exceed WHO recommendations from 2021 for particulate matter (PM2.5) and nitrogen dioxide (NO₂).
- In the vicinity of pollutant sources, pollution levels can even be significantly higher.
- The situation for NO₂ and PM2.5 has improved considerably since 2000, but the WHO recommendations for 2021 are still clearly exceeded.
- Ozone and PM2.5 pollution is heavily dependent on the weather. The values therefore fluctuate greatly.
Nitrogen dioxide (NO2), particulate matter (PM2.5) and ozone (O3) are of particular concern to human health. All three pollutants affect the respiratory organs. Many premature deaths are also attributed to particulates, as well as damages to ecosystems.
In 2021, the WHO published updated recommendations for air quality assessment based on the latest scientific findings on the health effects of air pollutants (WHO 2021), which are used to assess the indicator.
Air quality is particularly precarious in agglomerations, where one third of the German population lives. Here, industry, traffic and residential areas exist in close proximity. The indicator incorporates data from monitoring stations which measure background urban pollution levels. At busy locations in cities pollution levels may be significantly higher. The indicator represents the average discrepancy of all monitoring stations of urban background from WHO guideline values, respectively.
Since 2000, pollution from nitrogen dioxide and particulate matter has fallen significantly, but is still well above the target, 31% above the target for nitrogen dioxide and around 60% for PM2.5. However, ozone concentrations fluctuate widely. This is largely due to the influence of the weather. In hot summers such as 2003 or 2015, ozone concentrations rise sharply. Thus it is impossible to make a meaningful statement about the trend in recent years.
In 2008 the EU set out its air quality objectives in the Air Quality Directive (EU Directive – 2008/50/EC), in October 2022, the Commission presented a proposal to revise this directive (COM 2022) to take into account the new WHO recommendations 2021. . However, Germany will also miss some of the less ambitious targets of the current EU directive (UBA 2024). There is still a long way to go until the air in agglomerations is sufficiently ‘clean’.
The indicator is based on measurement data from the network of German air quality monitoring stations. All monitoring sites within an agglomeration were included in the measurement of urban and suburban background pollution levels. Measurements of these monitoring sites are used to calculate the extent to which the three pollutants NO2, PM2.5 and O3 exceed or fall short of WHO recommendations 2021. The average discrepancy between the values recorded at all monitoring stations and the WHO recommendation 2021 is calculated for each agglomeration. The average discrepancies are then averaged across all agglomerations and expressed in a standardised form with the WHO recommendation 2021.
More detailed information: 'Luftbelastung in Ballungsräumen' (in German only).
The UBA’s motto, For our environment (“Für Mensch und Umwelt”), sums up our mission pretty well, we feel. In this video we give an insight into our work.
Unfortunately, we are currently not available by telephone.There may currently be delays in answering enquiries. We ask for your understanding.
