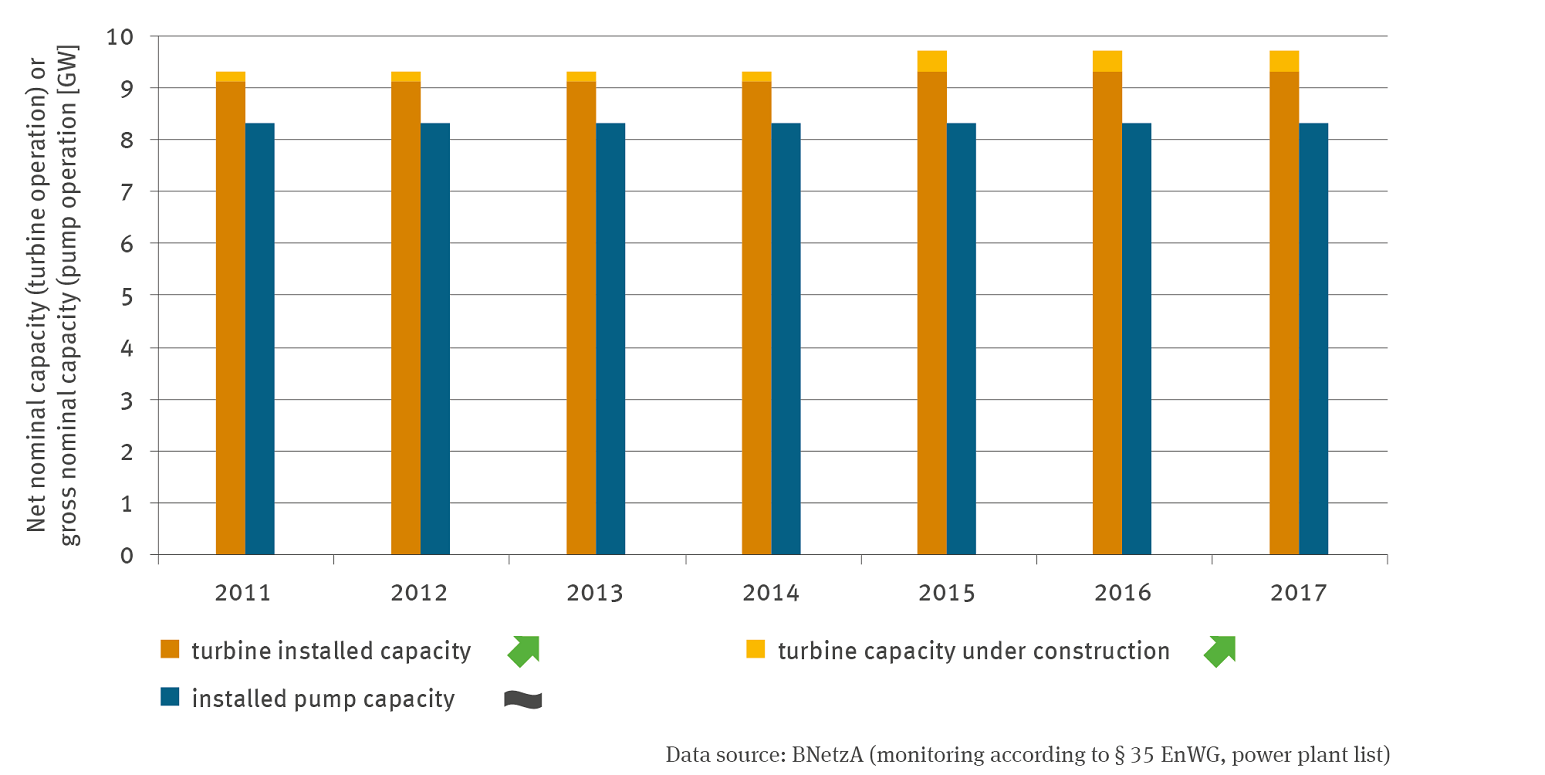
A block diagram shows with two columns each for the years 2011 to 2017 the net nominal capacity for installed and under construction turbine operation as well as the gross nominal capacity for installed pumping operation in gigawatts. There is a significant increasing trend for both installed turbine operation and turbine capacity under construction. No trend is discernible for installed pumping operation.
