
2023 Monitoring Report on the German Strategy for Adaptation to Climate Change read more
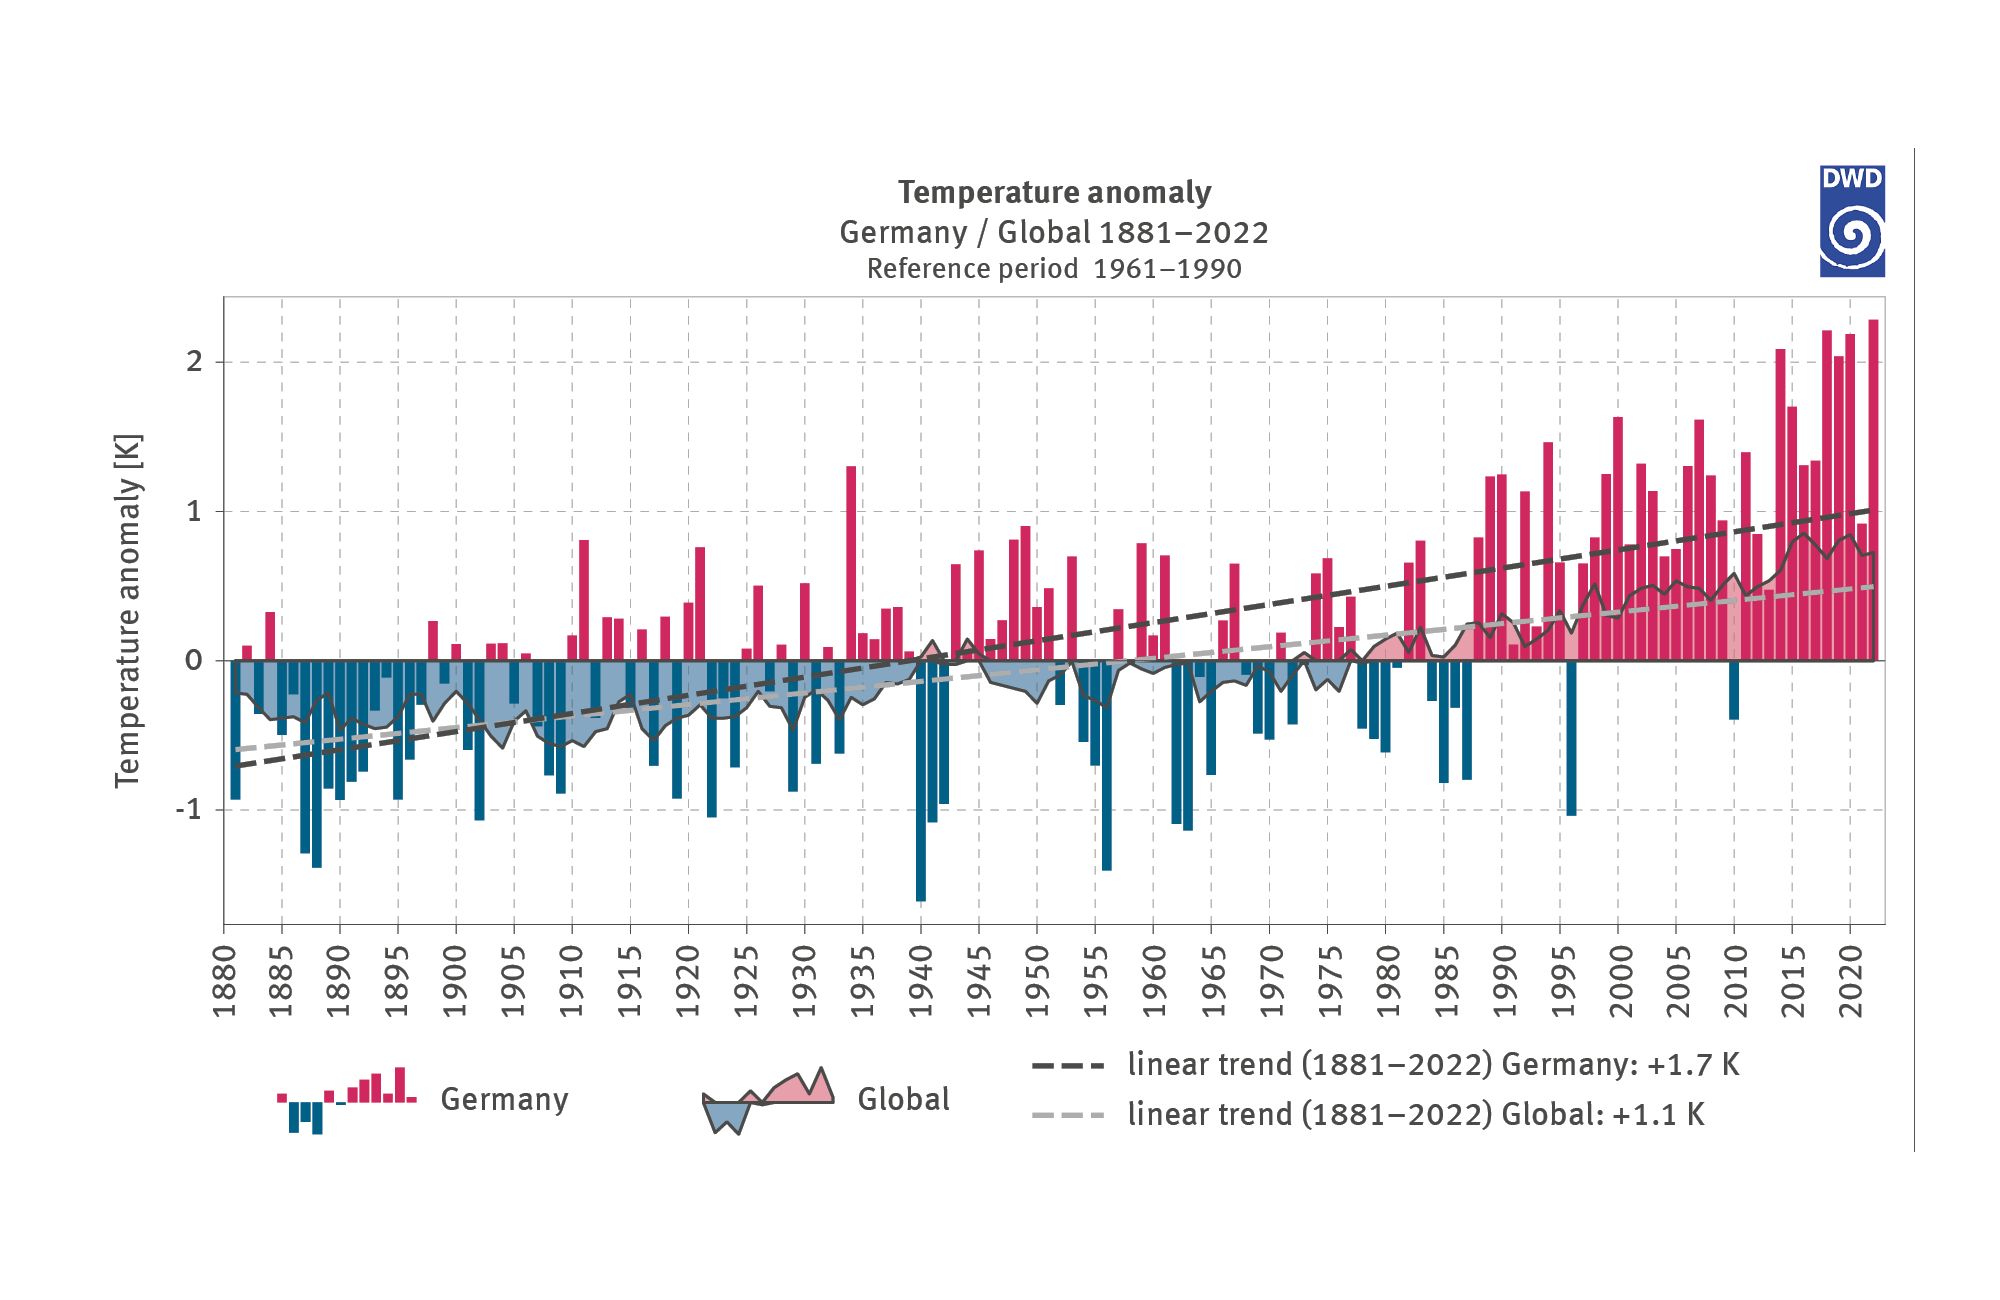
The chart shows deviations of the annual mean temperature for Germany and globally from the multi-annual mean for 1961 to 1990. The time series begins in 1881 and extends to 2022. The negative deviations are illustrated in blue below the zero line, while the positive deviations are in red above the zero line. Up until the 1980s there are still negative values; afterwards negative values occur in only two individual years. The positive deviations began with a few individual years in the 19th century after which they increased steadily. From the 1990s onwards, red predominates with very high increases. This is true for both Germany and for the global scale. In Germany, 2022 was the year with the highest deviation from the reference period by more than 2 kelvin. In the linear trend the values for Germany for the period examined demonstrate an increase by 1.7 kelvin compared to an increase by 1.1 kelvin at the global scale.
