New: Maps on air quality

Federal Environment Agency provides new online service

What is the annual average level of atmospheric particulates (PM10), nitrogen dioxide (NO2), and ozone pollution in Germany? All the answers are now available, totally free of charge, from the Federal Environment Agency at http://gis.uba.de/Website/luft/index.htm. The data in this geographic information system (GIS) provide a quick look at the regional distribution of air pollution in Germany, dating back to 2001. Site visitors can enhance the data on air with other geographical information about cities, rivers, and metropolitan areas, and by focusing on certain characteristics such as peak loads.

 

At the same time UBA has published facts and figures on air quality in Germany since 1995 in an information sheet titled Entwicklung der Luftqualität in Deutschland”. Human stress loads of air pollutants have fortunately been on the decline since the early 1990s. Since early 2000, however, there has been no clear downward trend as air quality has tended to fluctuate from year to year. Despite the successes of clean air policy, the limit values for PM10 which have been valid since 2005 and the caps on NO2 which will apply as of 2010 are already being exceeded in many locations throughout Germany.

The median immissions loads for PM10 and NO2 are highest in metropolitan areas, particularly in the vicinity of emission sources such as high-traffic roads. Pollution loads decrease further out in the countryside but does not apply for ozone. Peak loads are often found outside of metropolitan areas at some distance from the sources of its precursors nitrogen dioxide and volatile hydrocarbons.

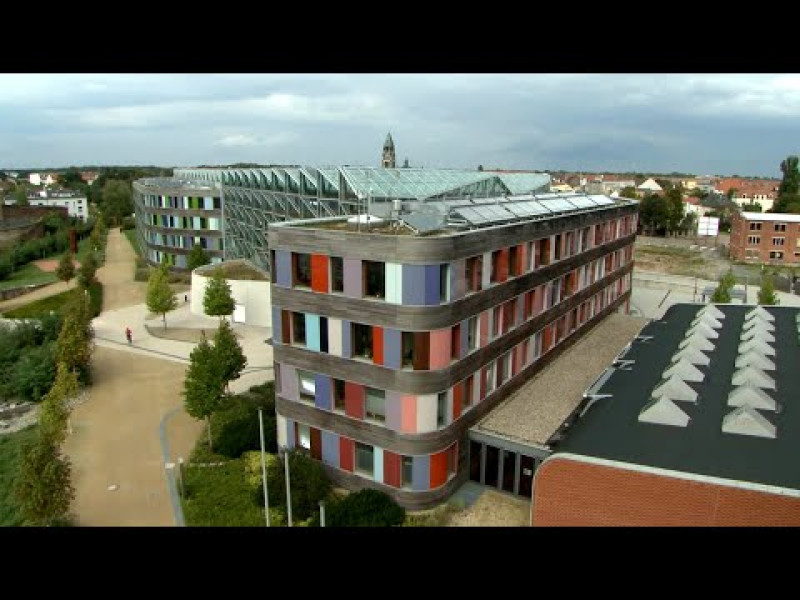
Umweltbundesamt Hauptsitz

Wörlitzer Platz 1
06844 Dessau-Roßlau
Germany

Share:
Article:
Printer-friendly version
Tags:
 Presse