The illustration entitled VE-I-2 ’Low-water restrictions on the Rhine’ is a grouped bar chart showing the number of days for the period of 1997 to 2021 when the equivalent water level values at the gauges of Maxau (Upper Rhine), Kaub (Middle Rhine) and Ruhrort (Lower Rhine) were not attained. Non-attainment of the equivalent water level signifies restrictions on the draught of vessels navigating the Rhine. There is no significant trend discernible for the Upper Rhine or the Middle Rhine.
VE-I-2: Low-water restrictions to shipping on the Rhine

The illustration entitled VE-I-2 ’Low-water restrictions on the Rhine’ is a grouped bar chart showing the number of days for the period of 1997 to 2021 when the equivalent water level values at the gauges of Maxau (Upper Rhine), Kaub (Middle Rhine) and Ruhrort (Lower Rhine) were not attained. Non-attainment of the equivalent water level signifies restrictions on the draught of vessels navigating the Rhine. There is no significant trend discernible for the Upper Rhine or the Middle Rhine. However, the Lower Rhine shows a significant rising trend regarding the number of those days. The values fluctuate distinctly from year to year. When low-water restrictions arise, this usually affects all three sections of the Rhine, although individual sections may be affected in different degrees. By far the highest values were recorded in 2018, with 80 days on the Upper Rhine, 107 days on the Middle Rhine and 128 days on the Lower Rhine. Other years with comparatively numerous days of draught restrictions always showed values of less than 50 days.

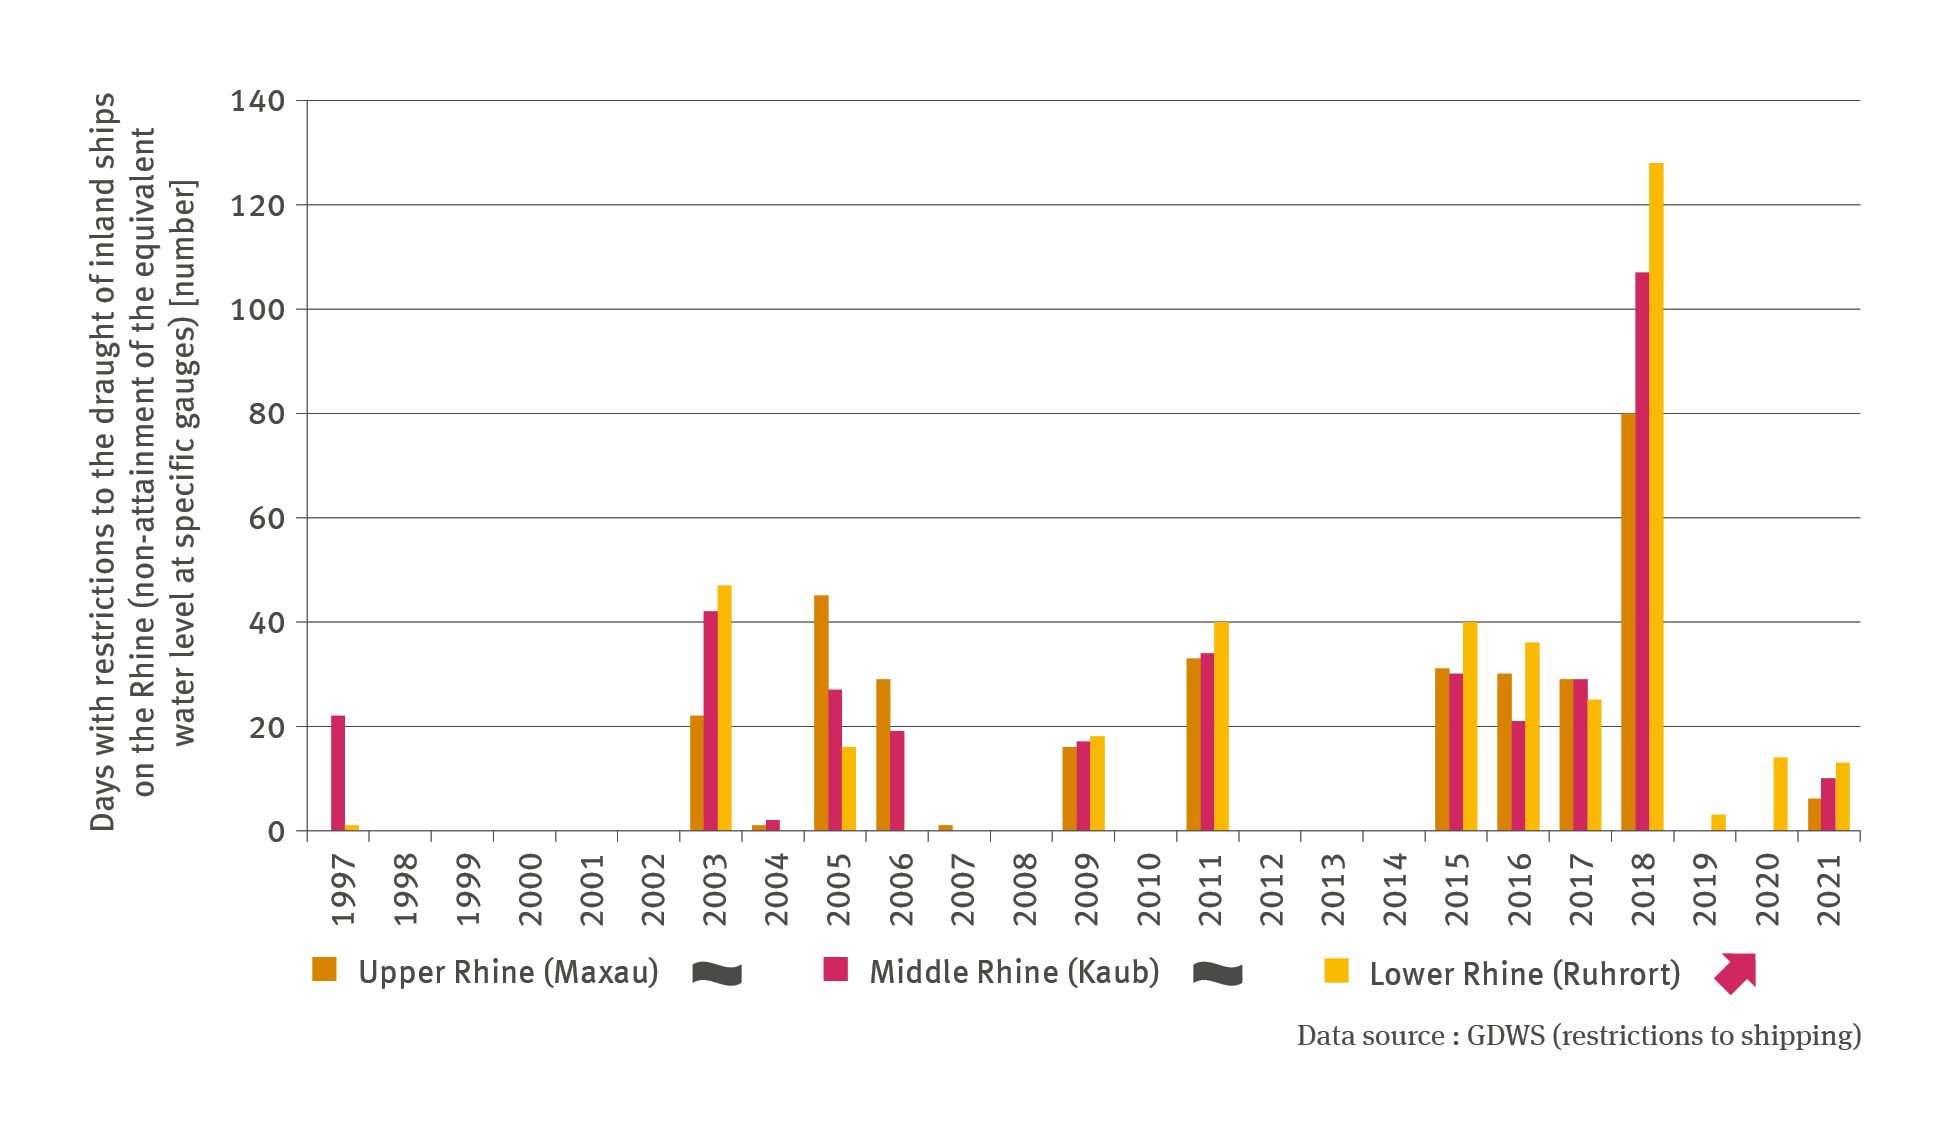
Source: Generaldirektion Wasserstraßen und Schifffahrt (restrictions to shipping)image download

The following pages contain this image or document

The Umweltbundesamt

For our environment