environmental damage

Umwelt-Indikator

Indicator: National Welfare Index

A graph shows the national welfare index (NWI) and gross domestic product (2000 = 100) for the years between 1991 and 2022. Since 2000, the NWI fell by 3.6 percent, while GDP rose by 27.6 percent.

A graph shows the national welfare index (NWI) and gross domestic product (2000 = 100) for the years between 1991 and 2022. Since 2000, the NWI fell by 3.6 percent, while GDP rose by 27.6 percent.The national welfare index (NWI) includes overall 21 activities that raise and diminish welfare.The NWI shows a different course than GDP. It fluctuates in phases, but there is no discernible long-term tr... read more

Indicator: Environmental costs of energy and road transport

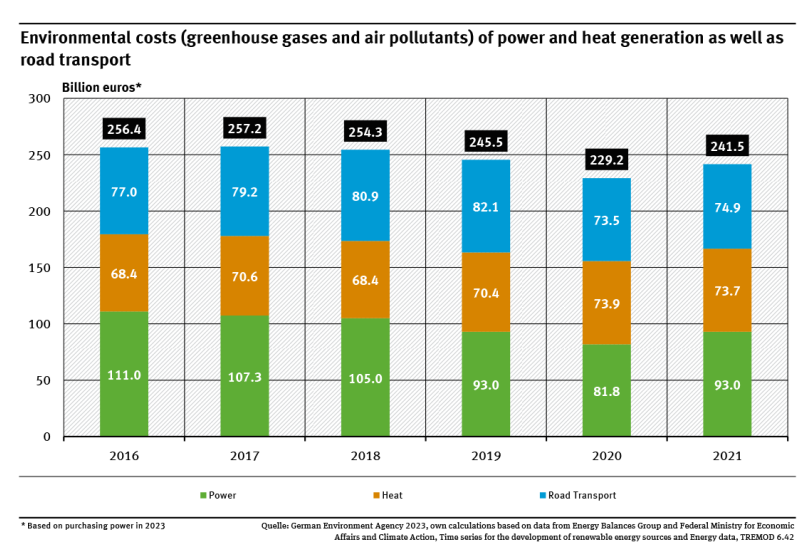
A graph shows the development of environmental costs energy generation and road transport between 2016 and 2021. They were 256.4 billion euros in 2016 and 241.5 billion in 2021.

Power generation, heat generation and transport activities pollute the environment, among other things, through the emission of greenhouse gases and air pollutants.This results in high subsequent costs for society, for example through environmentally-induced diseases, damage to ecosystems or even buildings.For Germany, these environmental costs are estimated to amount to almost 241 billion euros i... read more

The Umweltbundesamt

For our environment