The development of Germany’s climate since the end of the 19th century
The climate can be described as the mean condition of the atmosphere, characteristic extreme values and in terms of the frequency distribution of meteorological phenomena such as air temperature, precipitation and wind in a specific location. The climate is the outcome of complex interactions among all components that make up the system of land, atmosphere and oceans. Also part of this system are the biosphere with seasonal changes in vegetation, the hydrosphere, the soil and the cryosphere (ice). The climate can vary in different timescales even without the influence of human activity. This is well-known, for instance, from evidence of glacial periods which repeatedly enveloped major parts of Germany in an icy carapace. However, the assessment of observational data since the mid-19th century indicates progressive global warming which cannot be attributed to natural causes, and nowadays it is considered an established scientific fact that further temperature increases are to be expected. Both in Germany and globally, the mean value of average temperatures on the surface of land and water has steadily increased in the course of recent years. It can be stated that since the 1960s, every decade was warmer than the decade before6.
According to the analyses carried out by the American federal research organisations NASA and NOAA, the global average temperature is currently around 1.1 °C above the level prevailing at the end of the 19th century77. It should be noted that most of the warming occurred in the course of the past 50 years: 21 of the 22 warmest years in global records were recorded in the years since 2001, with 2016 being regarded globally as the warmest year so far, and the years from 2014 to 2022 were, in global terms, the nine warmest years since systematic records began.
For Germany, sufficient data exist from 1881 onwards making it possible to identify climatic changes nationwide. However, this can be said only for the monthly observation of variables such as temperature and precipitation. Relevant, mostly contiguous daily data as well as other measured variables such as sunshine duration are generally not available for the years prior to 1951. While the impact of additional greenhouse gases on the increase of temperature since 1881 is patently obvious, whereas the correlation with changes in the precipitation scenario is more indirect and hence less obvious. This is partly due to changes triggered by general warming in large-scale atmospheric weather patterns. Precipitation is a crucial factor in the availability of water and is virtually of the same major interest as temperature itself.
One consequence of global warming can be seen in major changes to extreme weather events. This includes, for instance, regional shifts resulting in extreme weather events occurring in areas where they had not occurred previously. Likewise, there is an increase – within some regions such as Germany – of extreme weather events including heatwaves, and a decrease in other extreme weather events such as severe frost. The change in extreme thermal events owing to climate change is quite distinct and also scientifically proven, leading to grave consequences for many sectors of society. As far as heavy-rain events and extended drought phases are concerned, statements tend to be more differentiated and less clear-cut.
The subsequent paragraphs are intended to: first provide an overview of the development regarding the mean values of climatic conditions which have prevailed in Germany since 1881, followed by an assessment of changes regarding extreme events and then a look at what our future climate will potentially be like.
Mean values of climate changes
The assessment of mean values for climatic conditions was based on summarising the monthly data available since 1881 regarding seasonal and annual mean values for variables such as temperature and precipitation. Furthermore, the data collected at selective points at meteorological stations were applied scientifically to Germany nationwide.
Temperature
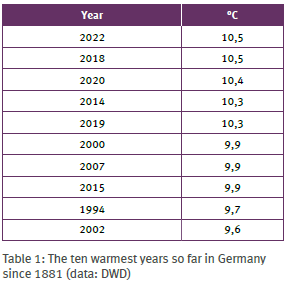
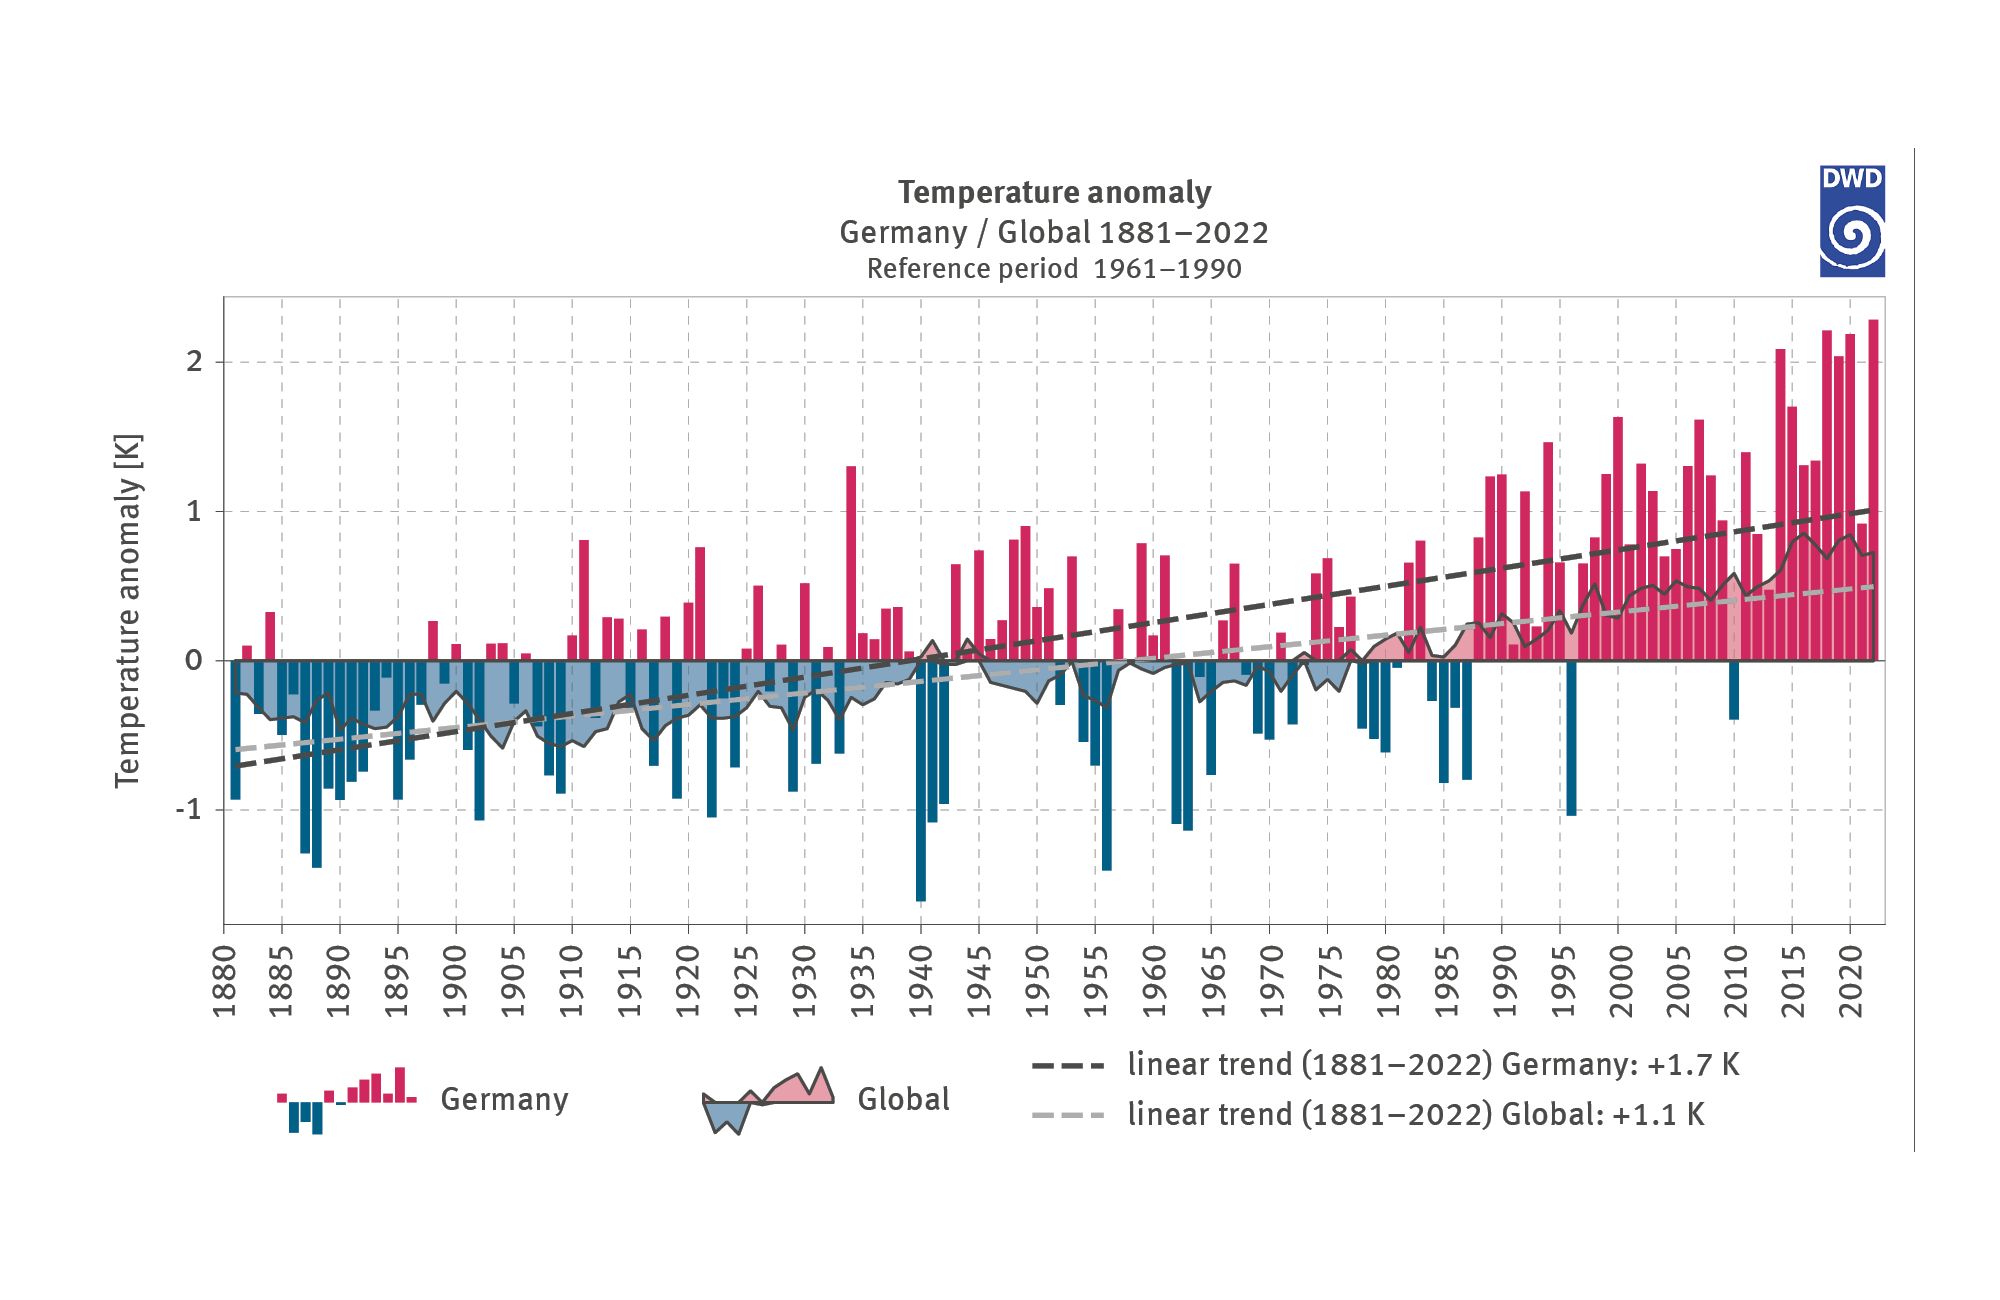
The annual air temperature as an aggregated mean for Germany between 1881 and 2022 was determined statistically to have risen by 1.7 °C (linear regression, see Fig.1). This value is by 0.6 °C higher than the global temperature increase throughout the same period of time. This is not surprising, as the terrestrial regions warm up faster than the marine regions. However, in the course of the past 50 years, the speed of temperature rise has distinctly increased both in Germany and worldwide: Looking at the entire period of 1881 to 2022, temperatures increased every decade by 0.12 °C, and since 1971 the warming rate of 0.38 °C per decade has resulted in making this value three times as high. However, since the 1960s in this country, every decade was distinctly warmer than the previous one, and compared to global warming amounting to roughly 1.1 °C, the past ten years (2013–2022) in Germany were already 2.1 °C warmer than the first decades (1881–1910) since records began (see Fig. 2). In other words, nine of the ten warmest years in Germany occurred in the 21st century (see Table 1). An annual mean temperature greater than 10 °C had never occurred in Germany prior to 2014. Since that year, a total of five years passed in which such high values occurred.
A close scrutiny of the temporal development shows that the rise in temperature did not take place evenly. In fact, there were phases of warming as well as periods of stagnation, interspersed from time to time with shorter periods during which temperatures tended to decrease slightly. One reason for this uneven progression is the wide range of fluctuations in atmospheric conditions from year to year with regard to, globally speaking, a relatively small region like Germany. Figure 1 demonstrates, in fact, that the variability of temperature in Germany (bars) is much greater than in the case of global temperatures (plane). However, in the course of periods extending over several decades, the so-called decadal climate variability has also played a crucial role. These are periodic fluctuations extending over several years or even a few decades, which are closely linked to ocean circulation – in other words, the sea currents. Depending on ocean circulation, there will be phases from time to time in which the surface temperatures of the sea either warm up or cool down, consequently leading to phases of warming or cooling in the atmosphere. These phases overlie the influence on the climate from external climate drivers. However, apart from natural elements such as solar irradiation and volcanic activity, human influences have to be taken into account, such as changes in land use, air pollution owing to sulphur dioxide output from industrial plant as well as emissions of greenhouse gases such as CO2. Periods of a greater cooling effect – exerted by ocean circulation on the surface temperature of the sea and consequently on the atmosphere – can therefore lead to a total concealment of the long-term trend, even at times when the total of external climate drivers alone would lead to warming. In phases of weak ocean circulation or in the absence of a cooling effect from ocean circulation, the temperatures observed have been rising.
In Germany the temperature rise observed hitherto seems to have been largely homogeneous throughout the country. Basically, this applies also to the various meteorological seasons. Just in winter (December to February) the value for a surface area mean of 1.9 °C is slightly above the annual mean. For the other seasons the temperature increase of 1.6 to 1.7 °C is the same as for the year as a whole. Roughly the same can be said regarding spatial differences. In this case, the annual mean temperature rise ranges from 1.5 °C to 1.8 °C – bearing in mind that the warming tendency in the western federal states as well as in Bavaria and Thuringia – has so far been somewhat higher, whereas in Brandenburg and Berlin, this tendency is somewhat lower than the mean value for Germany.
Table 1: The ten warmest years so far in Germany since 1881 Source: DWD
Figure 1: Annual mean air temperature for Germany
The chart shows deviations of the annual mean temperature for Germany and globally from the multi-annual mean for 1961 to 1990. The time series begins in 1881 and extends to 2022. The negative deviations are illustrated in blue below the zero line, while the positive deviations are in red above the zero line. Up until the 1980s there are still negative values; afterwards negative values occur in only two individual years. The positive deviations began with a few individual years in the 19th century after which they increased steadily. From the 1990s onwards, red predominates with very high increases. This is true for both Germany and for the global scale. In Germany, 2022 was the year with the highest deviation from the reference period by more than 2 kelvin. In the linear trend the values for Germany for the period examined demonstrate an increase by 1.7 kelvin compared to an increase by 1.1 kelvin at the global scale.
Source: DWD
Figure 2: Deviation of 10-year mean air temperatures from the multi-annual mean 1991–1910
The chart shows the deviations of the mean temperature of the 10-year periods from the multi-annual mean for the period from 1961 to 1990. The past 10-year periods are illustrated starting with 1881. The negative deviations are illustrated in blue below the zero line, while the positive deviations are in red above the zero line. It is clear to see that a negative deviation exists only for the 10-year period from 1881 to 1890. In the subsequent 10-year periods up until 1980, there were positive deviations amounting to a maximum of 0.8 kelvin. For the past three 10-year periods observations show that there were higher positive deviations of more than 1 kelvin. For the period of 2011 to 2020 the deviation of the 10-year mean temperature from the multi-annual mean reached 2 kelvin.
In contrast to temperature, there are distinct differences in changes to precipitation in Germany, especially by season but also in spatial terms. Overall, the rainfall mean has remained largely unchanged in summer, whereas particularly in winter, conditions have become significantly more humid. Likewise, the amounts of precipitation have increased at autumn and spring, although this increase is distinctly lower and statistically unproven. Overall, the surface area mean for Germany since 1881 shows an increase in the annual mean precipitation by 7.3 %. However, there are major differences from a spatial point of view. Especially the federal states in the north-west of Germany show distinct increases in wet conditions of almost 16 % in Schleswig-Holstein, whereas precipitation amounts in Mecklenburg-Western Pomerania, Saxony-Anhalt and Thuringia show only a slight increase in the annual mean (less than 10 %). In Saxony, conditions actually became slightly drier during the same period. Spatially the picture is basically similar for the transitional seasons of spring and autumn.
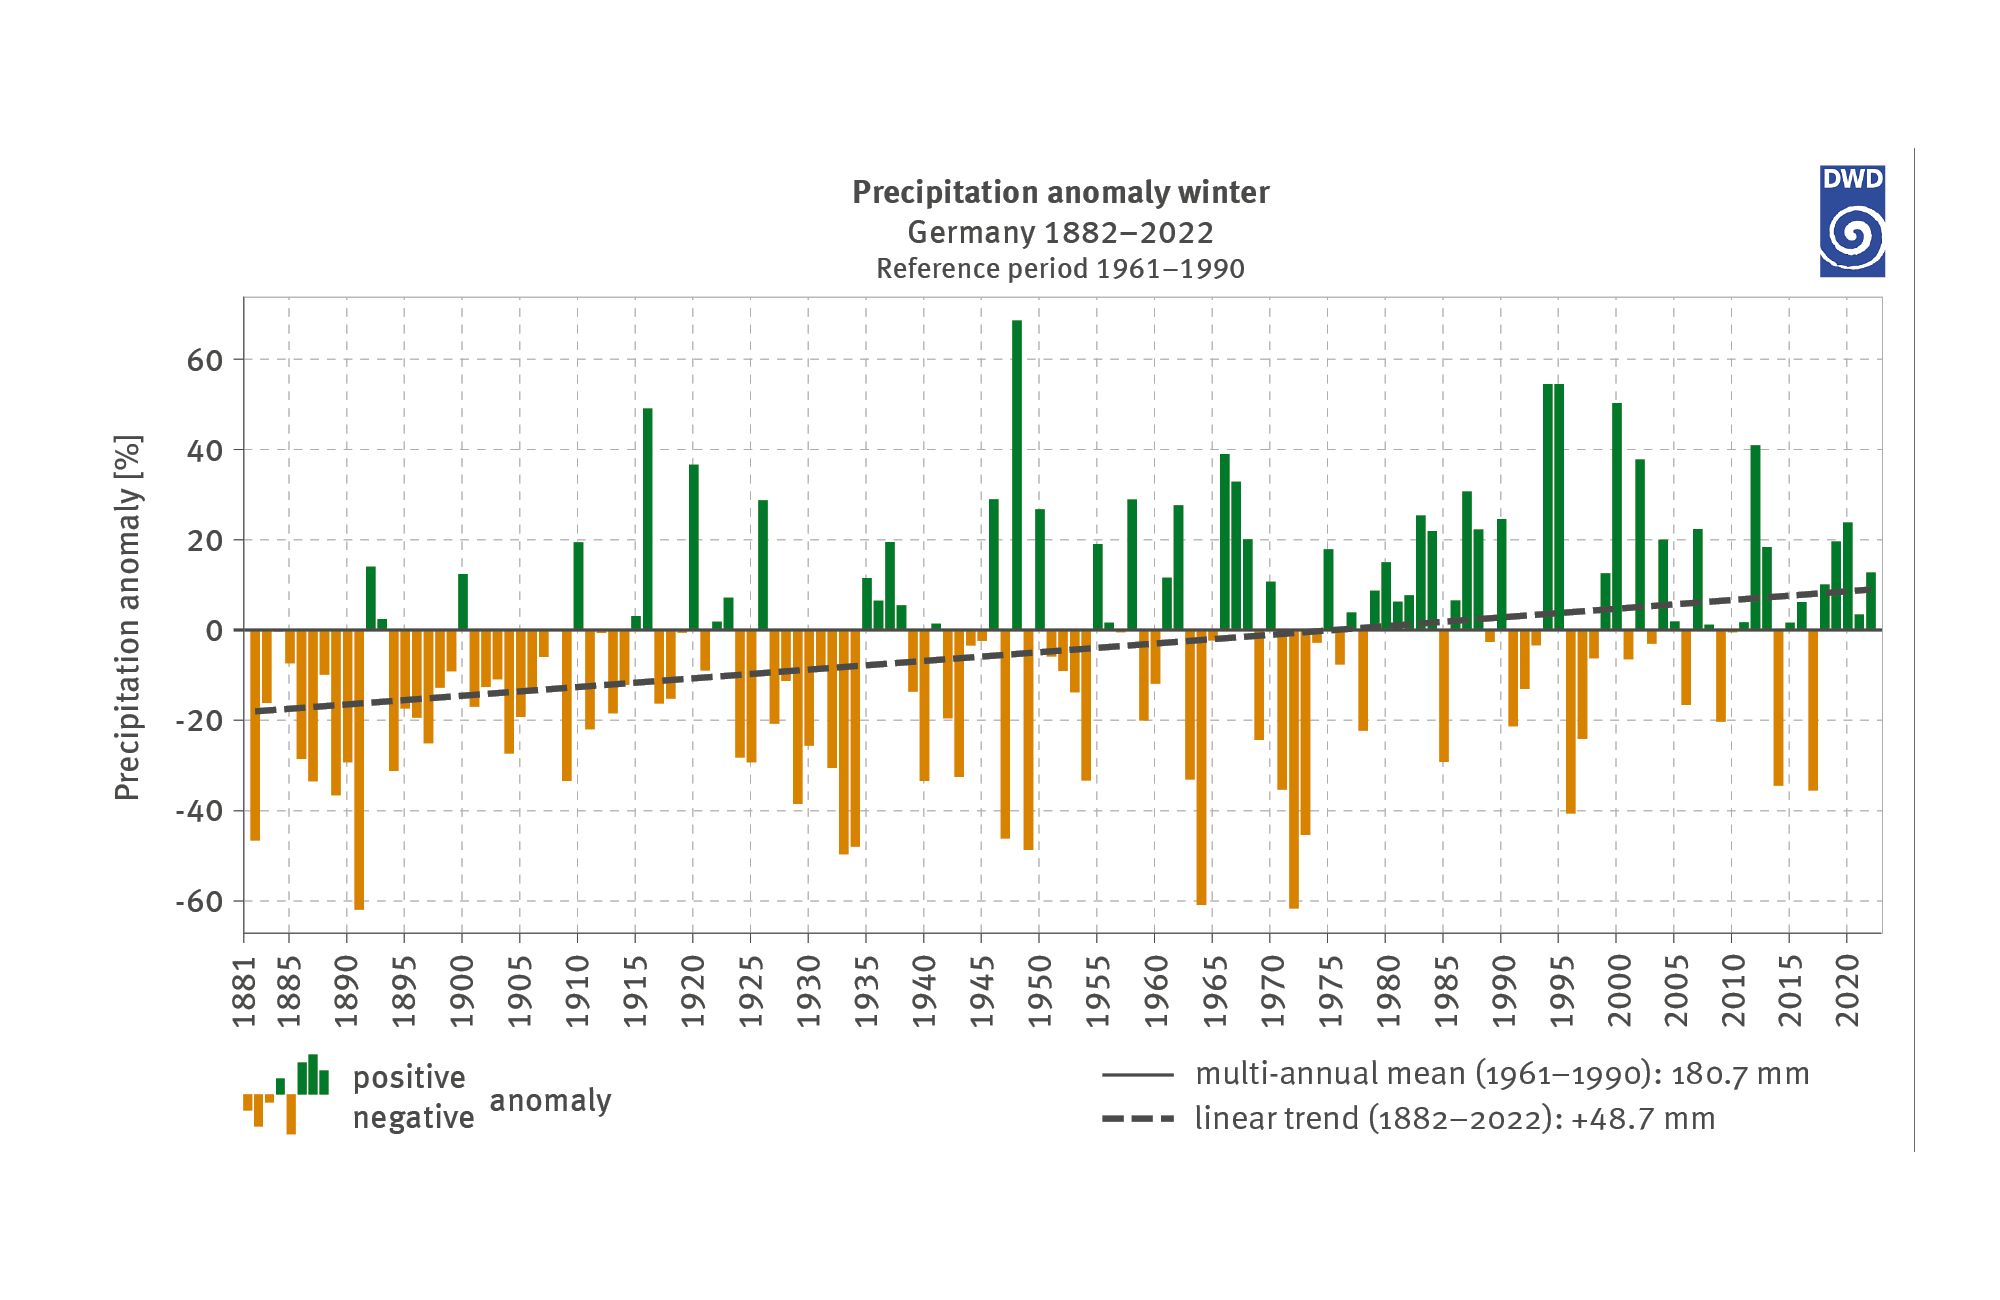
The strongest changes have so far been observed for the winter season. As demonstrated in Figure 3, the surface area mean for average precipitation levels has increased by roughly 48 mm (+26 %) since winter 1881/1882. The spatial distribution of changes is obviously similar to that of temperature at this time of year. In other words, the smallest increases – values of less than 25 % – have so far been recorded in the north-eastern federal states. In the other federal states, rainfall has increased by a greater value than the nationwide average. In the light of these spatially differing variables for warming and increases in precipitation, it can be said that the differences in the degree of continentality of regions, that is to say, the different relationship in terms of the influence of land and sea on the climate at a specific location, show a slightly rising tendency in the course of the 20th century. With regard to the summer months, there has been hardly any change so far. While it is true that the precipitation mean at that time of year has decreased by roughly 11 mm since 1881, it must also be said that the overall minimal decrease, which is within the range of natural variability, does not allow any conclusions even regarding tendency (see Figure 4).
Figure 3: Precipitation anomaly Germany winter
The graph shows the deviations of the annual mean of winter precipitation for Germany from the multi-annual mean for 1961 to 1990. The time series begins in 1882 and extends to 2022. The negative deviations are illustrated in yellow below the zero line, while the positive deviations are in blue above the zero line. The yellow bars show a more frequent and more extended tendency on the left-hand side of the chart, whereas from approximately 1960 onwards there are fewer and shorter yellow bars. From 1891 onwards there are only few blue bars, whereas approximately from 1960 onwards they occur more frequently. The multi-annual mean from 1961 to 1990 amounts to 180.7 millimetres. The linear trend for Germany for the period examined amounts to an increase by 48.3 millimetres.
Source: DWD
Figure 4: Precipitation anomaly Germany summer
The graph shows the deviations of the annual mean of summer precipitation for Germany from the multi-annual mean for 1961 to 1990. The time series begins in 1882 and extends to 2022. The negative deviations are illustrated in yellow below the zero line, while the positive deviations are in blue above the zero line. The yellow bars are distributed over the entire time series, although it is not possible to identify a distinct pattern. The same is true for the blue bars. There is a striking above-average number of blue bars indicated for the 1960s. For the past 10 years there are more yellow bars indicated. The multi-annual mean from 1961 to 1990 amounts to 239.4 millimetres. The linear trend for Germany for the period examined amounts to a decrease by 11.2 millimetres.
As the term implies, extreme situations are rare as they deviate strongly from usual situations. Consequently, statistical analyses are less resilient than assessments of mean conditions. So-called once-in-a-century events (in other words, extreme events which statistically occur once in 100 years) for instance, have to be determined on the basis of series of measurements which typically extend to little more than a hundred years. A relatively easy and very descriptive method of determining changes in extreme events are so-called climatological indicators on which threshold values are recorded; these are termed threshold value events. This is, in fact, an assessment of days on which, for instance, the maximum temperature exceeds a specific threshold value, as for example the number of hot days with a maximum temperature of at least 30 °C. Apart from such threshold values, it is possible to utilise other indicators which can also be used for recording persistent extreme climate events such as heat or drought periods. The subsequent paragraphs present and discuss various indicators for the analysis of changes in extreme events regarding temperature and precipitation levels.
Statistically backed statements are already available today regarding changes in the frequency of cases where threshold values have been exceeded in terms of temperature; as indicated by the data, heat periods have become more frequent and more intensive throughout Germany since 1951. It is more difficult, however, to make reliable statements regarding trends of heavy precipitation events. On one hand, such events entail a high variability in terms of space and time, while on the other, especially during the summer months, convective events – the development of showers and thunderstorms – are considered relevant in cases where they occur within the space of an hour or less. Although it is possible to observe tendencies towards a greater frequency of heavy precipitation events in the course of the past 65 years, it has so far not been possible, owing to the lack of available data, to make any statistically backed climatological statements on changes in heavy precipitation events.
Temperature extremes
For the analysis of temperature extremes, the amount of hot days as well as ice days (days with a maximum temperature of < 0 °C) were examined. Furthermore, the most intensive annual 14-day heat period with a daily maximum of at least 30 °C air temperature for the period 1950–2022 was assessed for eight German cities.
Since 1951 there has been an increase in the number of hot days in Germany from a mean of approximately three days annually to a current mean of approximately ten days annually (see Fig. 5left). Prior to 1994, more than ten hot days were never recorded in Germany before. The years with the greatest number of hot days were 2018, 2003, 2015, 2022 and 2019. The increase in hot days is backed up by statistics, notwithstanding great variability of this index from year to year. By comparison, the considerable decrease in the mean of ice days from roughly 27 days to currently approximately 18 days annually is statistically significant (see Fig.5 right).
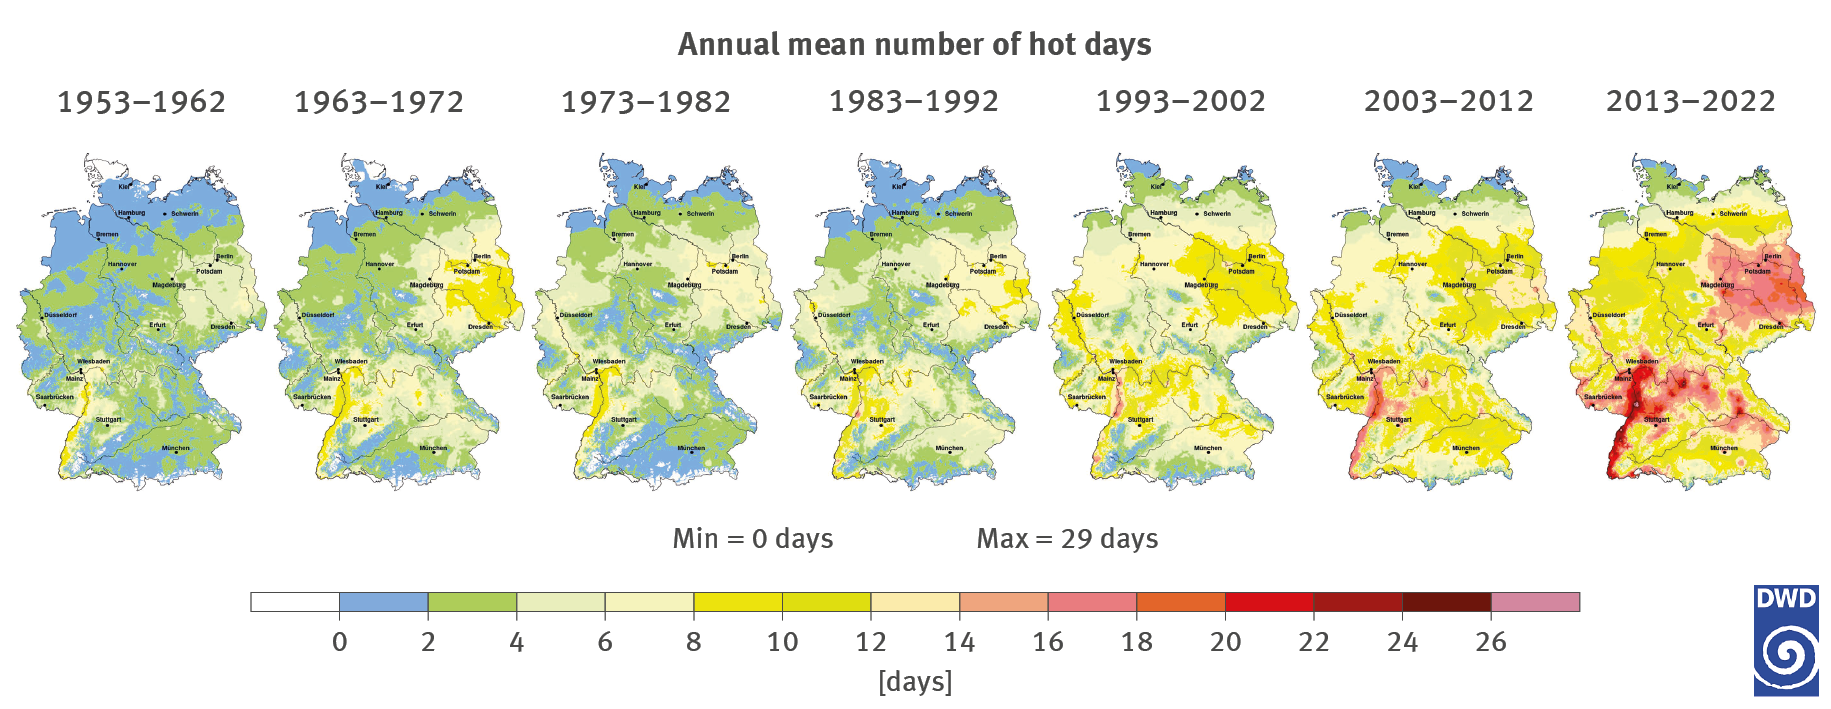
The temporal development of surface area mean values contained in temperature indicators is clearly reflected in their spatial development (see Fig. 6). Likewise, the major spatial differences between individual German regions are clearly visible.
In the period of 1953 to 1962 the mean of hot days amounted in many areas to between zero and four days annually. Just along the Rhine trough and in north-east Germany south of Berlin between four and eight such days occurred, while in parts of the southern Rhine trough up to ten such days occurred (see. Fig. 6). Up until the decade of 2003–2012, the number of hot days increased on average by up to 18 days annually. The extreme north of Schleswig-Holstein was the only area where that decade again showed fewer than two hot days annually. In the course of the past ten years the number of hot days, especially in eastern Germany, has again increased markedly. Consequently, the multi-annual mean in large areas of the south and east shows more than ten such days annually.
Figure 7 shows the most intensive annual 14-days heat period for several German cities, with a daily maximum air temperature mean of at least 30 °C for the period 1950–2022. Regarding the cities examined, it is clear to see that both the frequency and intensity of intensive heat periods show a rising tendency from north to south. Generally speaking, the mean of the highest daily maximum temperature in heat periods in northern cities lies below 33 °C; this value is often exceeded in the southern cities. There are fewer recordings for Munich than is typical for the south, because the recording station is located at a relatively high altitude (515 metres). Furthermore, it can be seen that such extreme heatwaves have occurred more frequently since the 1990s; for instance, Hamburg never experienced such events between 1950 and 1993, whereas six extreme heatwaves have occurred there since 1994.
Figure 5: Deviation of the number of hot days for Germany from the multi-annual mean 1961–1990
The chart consists of two illustrations: one for the number of hot days (in red), and one for the number of ice days (in blue), for the period 1951 to 2022. The graph shows the annual deviation of the number from the multi-annual mean for the period 1961 to 1990. The multi-annual mean of hot days from 1961 to 1990 amounts to 4.2 days. The linear trend for Germany, for the period examined, amounts to an increase by 8.6 days. The height of red bars shows a distinct increase, albeit with annual fluctuations. The multi-annual mean of ice days from 1961 to 1990 amounts to 26.2 days. The linear trend for Germany for the period examined amounts to a decrease by 13.6 days. Up until the turn of the millennium, the blue bars indicate swings up and down. After the turn of the millennium, positive fluctuations occurred in only three years.
Source: DWD
Figure 5: Deviation of the number of ice days (right) from the multi-annual mean 1961–1990
The chart consists of two illustrations: one for the number of hot days (in red), and one for the number of ice days (in blue), for the period 1951 to 2022. The graph shows the annual deviation of the number from the multi-annual mean for the period 1961 to 1990. The multi-annual mean of hot days from 1961 to 1990 amounts to 4.2 days. The linear trend for Germany, for the period examined, amounts to an increase by 8.6 days. The height of red bars shows a distinct increase, albeit with annual fluctuations. The multi-annual mean of ice days from 1961 to 1990 amounts to 26.2 days. The linear trend for Germany for the period examined amounts to a decrease by 13.6 days. Up until the turn of the millennium, the blue bars indicate swings up and down. After the turn of the millennium, positive fluctuations occurred in only three years.
Source: DWD
Figure 6: Mean annual number of hot days
The chart consists of seven maps of Germany. The maps convey the mean annual number of hot days displayed in a very small unrecognisable grid for the following periods: 1953–1962, 1963–1972, 1973–1982, 1983–1992, 1993–2002, 2003–2012 and 2013–2022. The range extends from 0 days (in shades of blue) to a maximum of 29 days (in shades of red), with two days each forming a category. From left to right the maps are increasingly dominated by shades of red. In the period from 2013 to 2022, the red shades dominate with a high number of hot days, especially along the Upper Rhine Rift Valley, in eastern Germany and in parts of the Bayerische Wald (in Bavaria). For the northern border of Germany, this period shows only a small area near the coast as belonging to the lowest category of 1 to 2 days.
Source: DWD
Figure 7: Mean value of the warmest 14-day period per annum for eight German cities
The chart is composed of eight individual graphs for the cities selected. The illustration shows the mean daily maximum of heatwaves from 1950 to 2022 and the highest mean daily maximum in a heatwave. The latter occurred in Hamburg at 31.8 degrees Celsius and in Berlin at 33.5 degrees in 1994; in Frankfurt am Main at 35.8 degrees Celsius, in Mannheim at 36.5 degrees, in Nuremberg at 34.2 degrees and in Munich at 33.1 degrees in 2003. In Dresden the heat record of 1994, measured at 32.7 degrees, was repeated in 2018. Cologne reached its own record temperature in 2018 with 33.6 degrees. From the 1990s onwards, heat waves have occurred more frequently across all time series. The mean daily maximum of the heatwaves in 2022 amounted to 30.2 degrees in Cologne, to 31.6 degrees in Frankfurt am Main und Mannheim, to 30.9 degrees in Nuremberg and to 30.1 degrees in Munich respectively.
Relatively warm air is able to absorb more water vapour than relatively cold air. This is why principally, warming with consistent relative air humidity are expected to coincide with greater precipitation. Besides, it can be assumed that, especially on the so-called convective scale, the development of showers and thunderstorms, an intensification of processes leading to the development of clouds and precipitation can be expected as a result of changes in meteorological conditions. Heavy precipitation events occurring under such conditions would then even increase disproportionately compared to the increased content of water vapour in the air. The term heavy rain is used for major amounts of precipitation falling in a relatively short time. In this case, precipitation events typically result from convective clouds (such as cumulonimbus clouds). Heavy rain can lead to a fast rise in water levels and flooding which is often accompanied by soil erosion. The three warning levels employed by the DWD for different durations are illustrated in Table 2.
It must be borne in mind, however, that several other factors and processes play an essential role in the development of precipitation, thus leading to regional differences. Presumably, heavy rain events do not occur in all places to the same extent.
In analysing heavy rain events on the basis of conditions prevailing at gauging stations, a differentiation is often made between daily precipitation totals and shorter intervals down to durations of 5 minutes. However, many investigations are limited to a minimal temporal resolution of 60 minutes. The frequency of heavy-precipitation events lasting 24 hours (see also Table 2) has not changed much in Germany over the past 70 years, although a minor increase was observed for the entire calendar year and most of the meteorological seasons. Owing to the overall infrequent occurrence of such events and their great variability from year to year, these trends cannot be considered statistically significant which means that they are not really meaningful.
In contrast, there are relatively few findings available for heavy precipitation of short durations occurring predominantly in summer in Central Europe. Admittedly, there are some indications for an increase in the intensity of convective events as temperatures rise. However, there is a distinct requirement for further research regarding this timescale. Trend analyses of heavy precipitation are principally hampered by the fact that not all particularly intensive precipitation events of limited spatial extent are necessarily captured by meteorological stations. In fact, sometimes they occur in the space between these stations and therefore elude recording. It is true that, in addition, there are radar data available for the past roughly 20 years for contiguous areas, but such timescales are currently too short to permit making any robust trend statements.
Radar data have made it possible to capture and enumerate the occurrence of heavy-rain events for contiguous areas. Figure 8 shows that the hours of heavy precipitation of particularly high intensity amounting to more than 25 mm/h in 6 hours, or more than 35 mm per 6 hours, respectively, in Germany (see Fig.8, middle) are distinctly more evenly distributed than the total hours of moderately heavy rain (see Fig.8, left) where the spatial distribution is strongly linked to Germany’s topography. This demonstrates clearly that spatially extremely small-scale heavy-rain events of short duration and with high damage potential can occur anywhere and affect anyone in Germany; in other words, these conditions constitute a hazard which is not limited to the southern federal states of Germany only. In fact, a temporal extension of this kind of heavy rain analysis will in a few years from now allow a robust trend analysis for the related frequency of events where threshold values are exceeded.
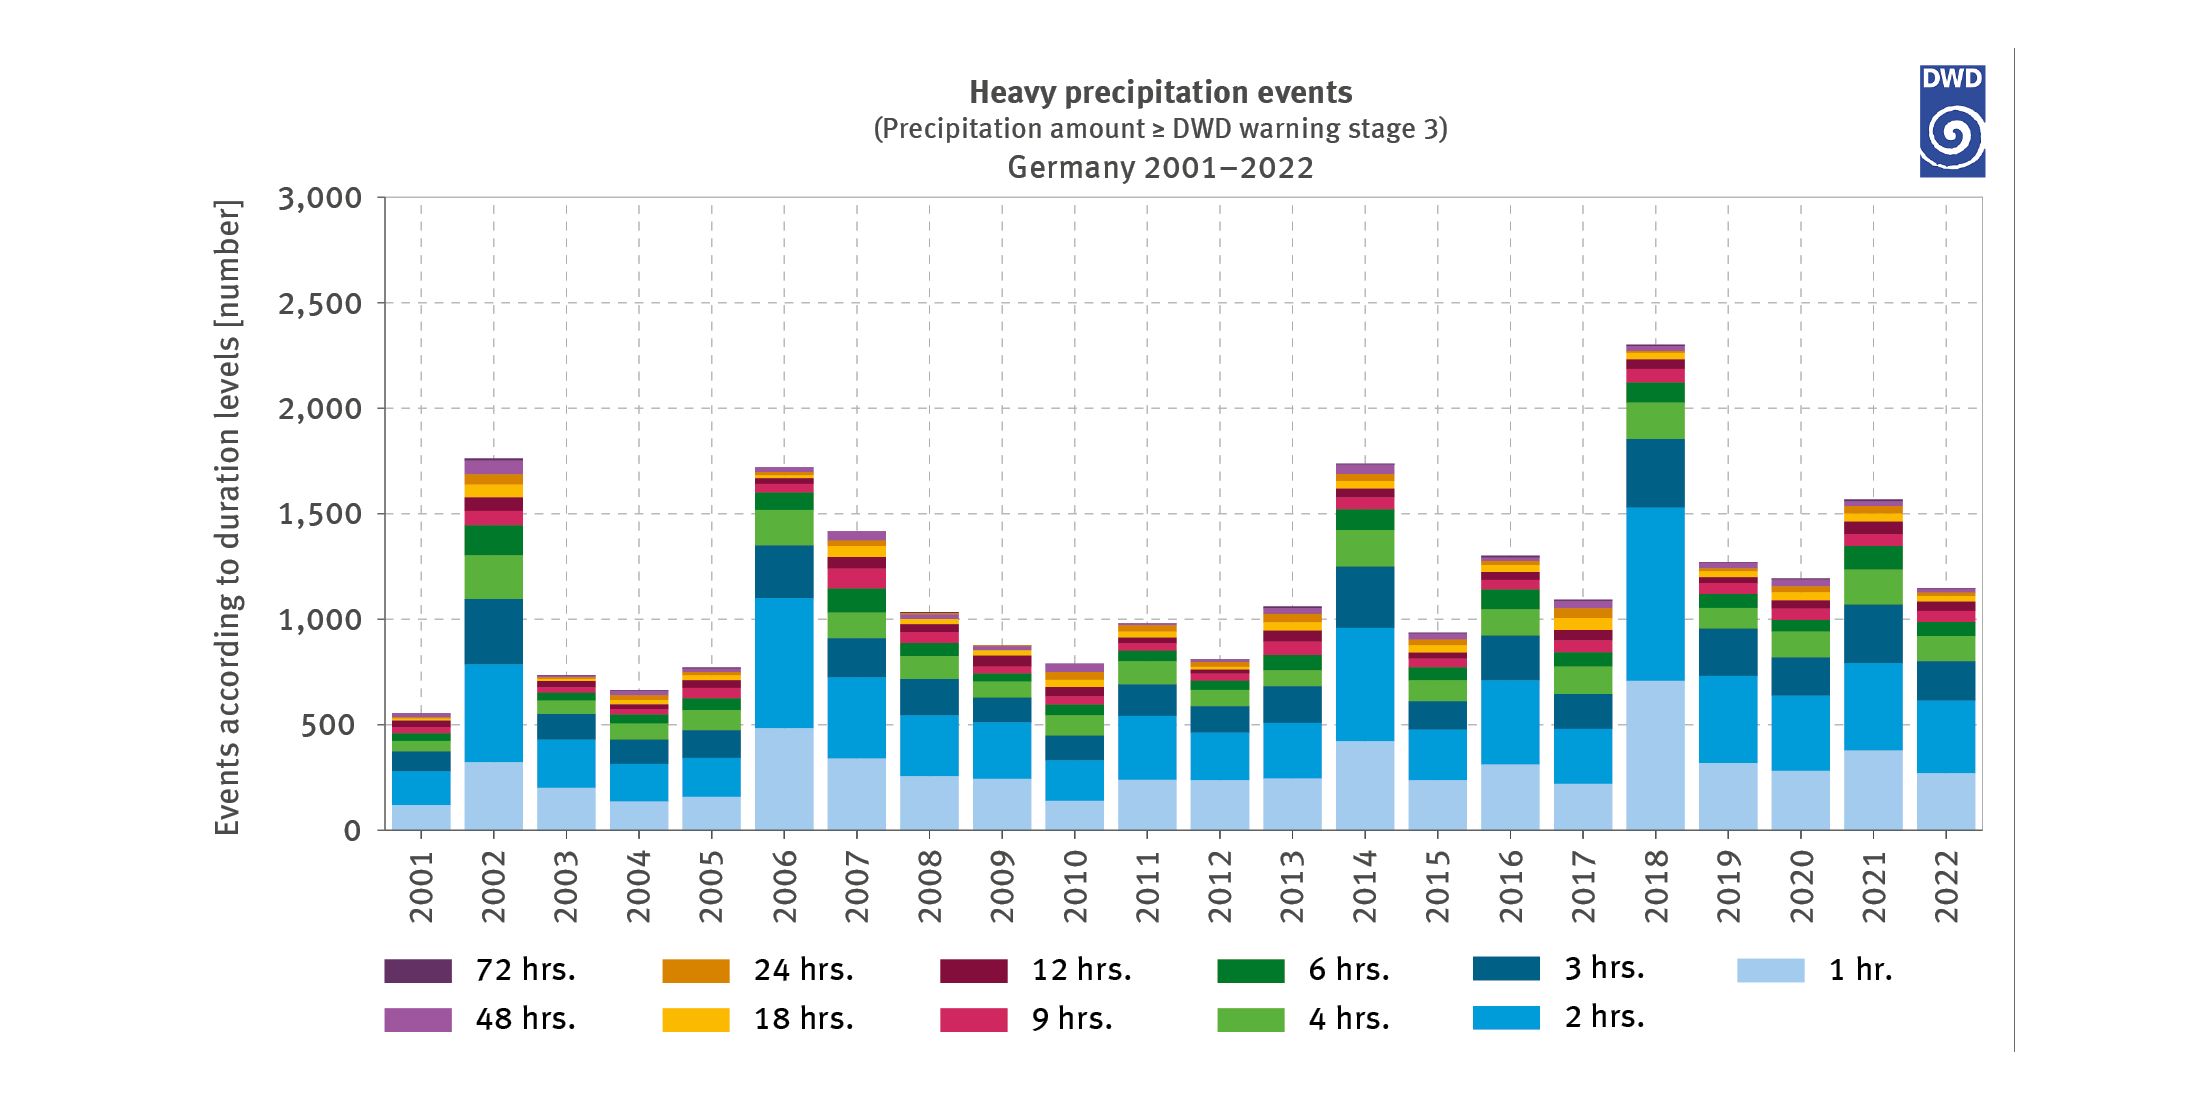
On the basis of a time series of radar data collected for 22 years, heavy-rain events were catalogued in the CatRaRE (Catalogue of Radar-based heavy Rainfall Events) and listed under 11 different duration levels varying between 1 and 72 hours. In addition to variables such as duration level, point of occurrence and precipitation intensity which can be determined on the basis of radar data alone, CatRaRE also contains demographic and geographical information on the events concerned. Figure 9 indicates the frequency distribution of precipitation events in Germany for the years 2001 to 2022 for the 11 duration levels. This, too, demonstrates that the number of events varies strongly from year to year between 554 events in 2001 and 2,304 in 2018. Initially it seems surprising that the greatest number of heavy-rain events occur in 2018 considering that the mean value for 2018 indicates that this was a comparatively dry year. However, 2018 also was an extraordinarily warm year. This validates the assumption that, in particular, relatively warm years can have a greater frequency of extreme convective precipitation events, because the duration levels of 1 to 6 hours alone account for more than 2,000 events in 2018. Although the time series of 22 years is still too short to allow a resilient statement on climate trend, it is nevertheless possible to identify a slight increase in the number of heavy-rain events in the period examined.
Table 2: DWD warning levels for various duration levels of heavy and persistent rain Source: DWD
Figure 8: Total of precipitation hours
The chart consists of three heavy-rain maps for Germany regarding the following warning levels 2 – extraordinary weather, 3 – tempest, and 4 – extremely severe weather. The total hours of precipitation are shown for the period 2001 to 2022 when warning thresholds were exceeded. For level 2 this amounts to more than 15 litres per square metre in one hour and more than 20 litres in 6 hours; for level 3 the amount is more than 25 litres per square metre in one hour and more than 35 litres in 6 hours; for level 4 the amount is more than 40 litres per square metre in one hour and more than 60 litres in 6 hours. The grid cells are each coloured in seven categories of different lengths which cover various durations according to the warning level concerned: for level 2, from 0 to more than 600 hours, for level 3 from 0 to more than 80 hours and for level 4 from 0 to more than 8 hours. Lighter shades indicate shorter durations, darker shades signify longer durations. The darker shades dominate in mountain areas and in the foothills of the Alps as well as in the south of Saxony near the Czech border.
Source: DWD
Figure 9: Annual number of heavy-precipitation events differentiated by duration levels
The illustration covers the period from 2001 to 2022 using stacked columns to show the annual number of heavy-rain events in Germany, differentiated by eleven duration levels – 1 hour, 2 hours, 3 hours, 4 hours, 6 hours, 9 hours, 12 hours, 18 hours, 24 hours, 48 hours and 72 hours. In this context, a heavy-rain event is an amount of precipitation which equates to DWD warning level 3 or higher. In the course of the period examined, the height of the columns increased, albeit subject to slight fluctuations; in other words, the number of heavy-rain events shows a rising tendency. The events of 1 hour duration and 2 hours duration respectively account for the greatest proportion of all events. Typically, they account for approximately 50 per cent of all heavy-rain events. Individual years with a particularly high number of heavy-rain events stand out from the time series. In the years of 2002, 2006, 2014 and 2021 more than 1,500 heavy-rain events occurred. In 2018 the value amounted to more than 2,000.
In recent years drought has become a topic that is very much in focus. Apart from the issue of changes in heavy-precipitation events it is crucial, especially in summer, to examine to what extent warming is accompanied by additional soil dehydration. Agriculture is particularly vulnerable to drought, but other infrastructures such as water management and energy supply are also affected. In agriculture the term drought always refers to the condition of plants which – owing to lack of water resources in the soil – either have to limit their photosynthesising activity or, in extreme cases, have to die. Inadequate availability of water in the soil can be caused either by the absence or lack of precipitation and by high evaporation rates of plants; these rates are higher in dry and warm weather than under cold and humid conditions.
An ideal indicator for the degree of water supply available to plants is the soil humidity which is expressed as a percentage of usable field capacity (% nFK). The usable field capacity (nFK) is a relative measurement for the amount of soil water available for absorption by plants. If soil humidity drops to less than 30 % up to 40 percent nFK, this will distinctly reduce the photosynthetic performance thus leading to reduced plant growth. The longer a plant remains in this condition, the more severely it can be damaged. It was therefore considered essential to examine the number of days on which the critical soil humidity values of 30 % nFK for the cultivation of winter wheat were not reached. The examination focused on the main growth period of winter wheat, which will typically last from March until July or August. Furthermore, the type of soil also has a major influence on soil humidity. Heavy soil (such as sandy clay) is able to store more water for plants than light soil (such as clay-rich sand); that is why the former is able to bridge longer periods of drought than the latter.
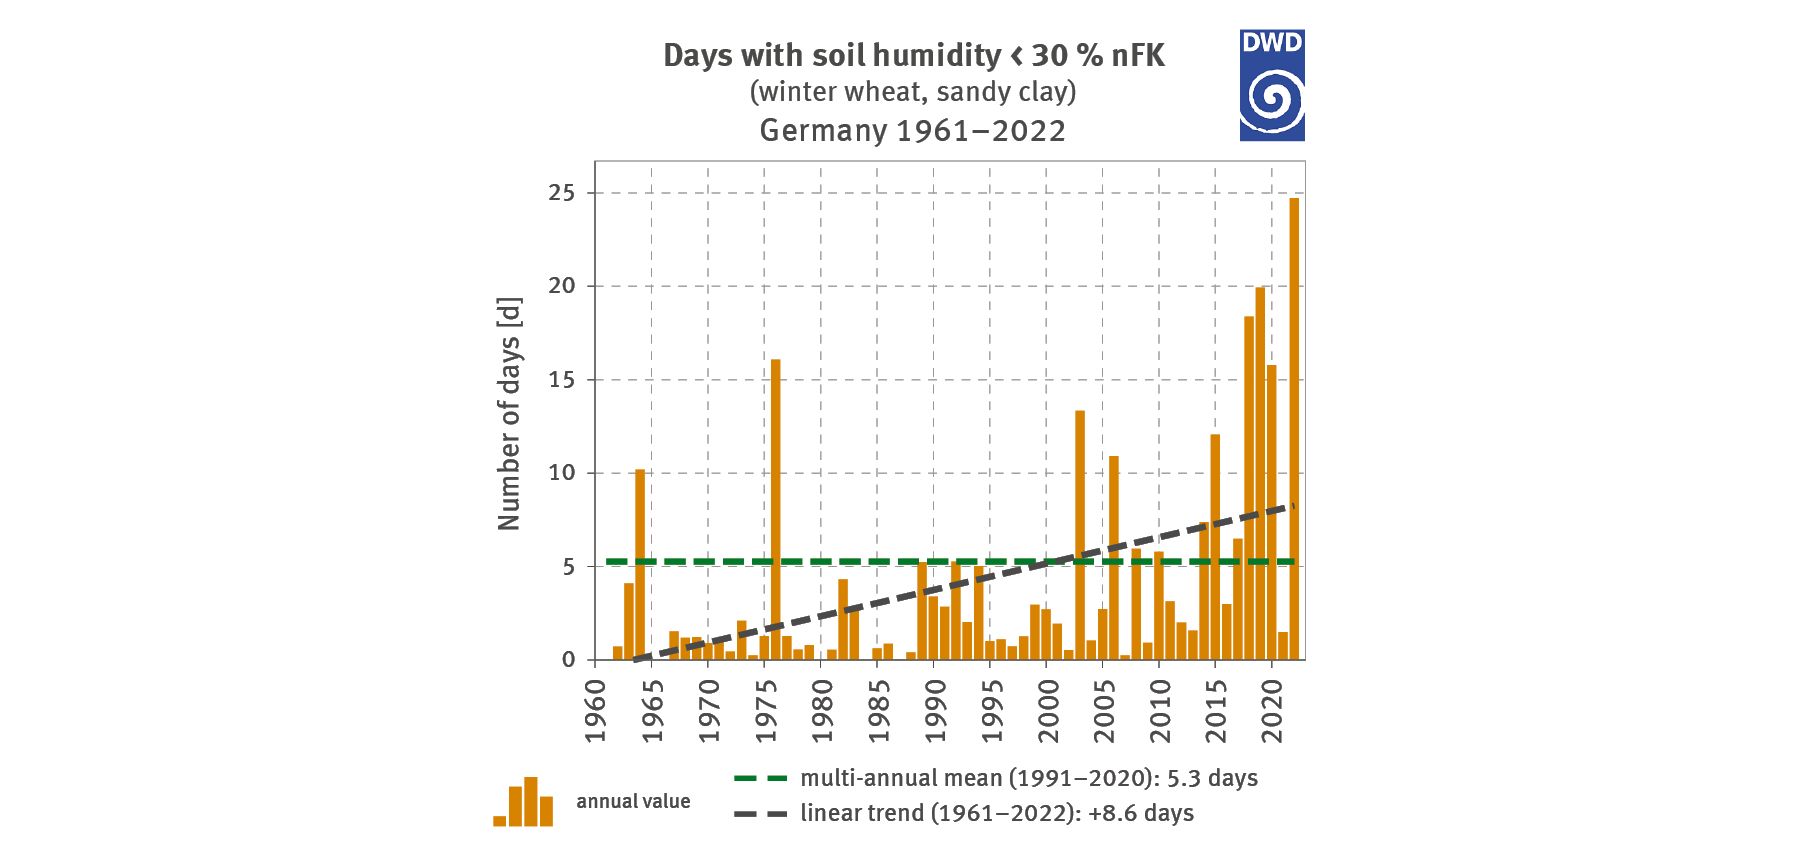
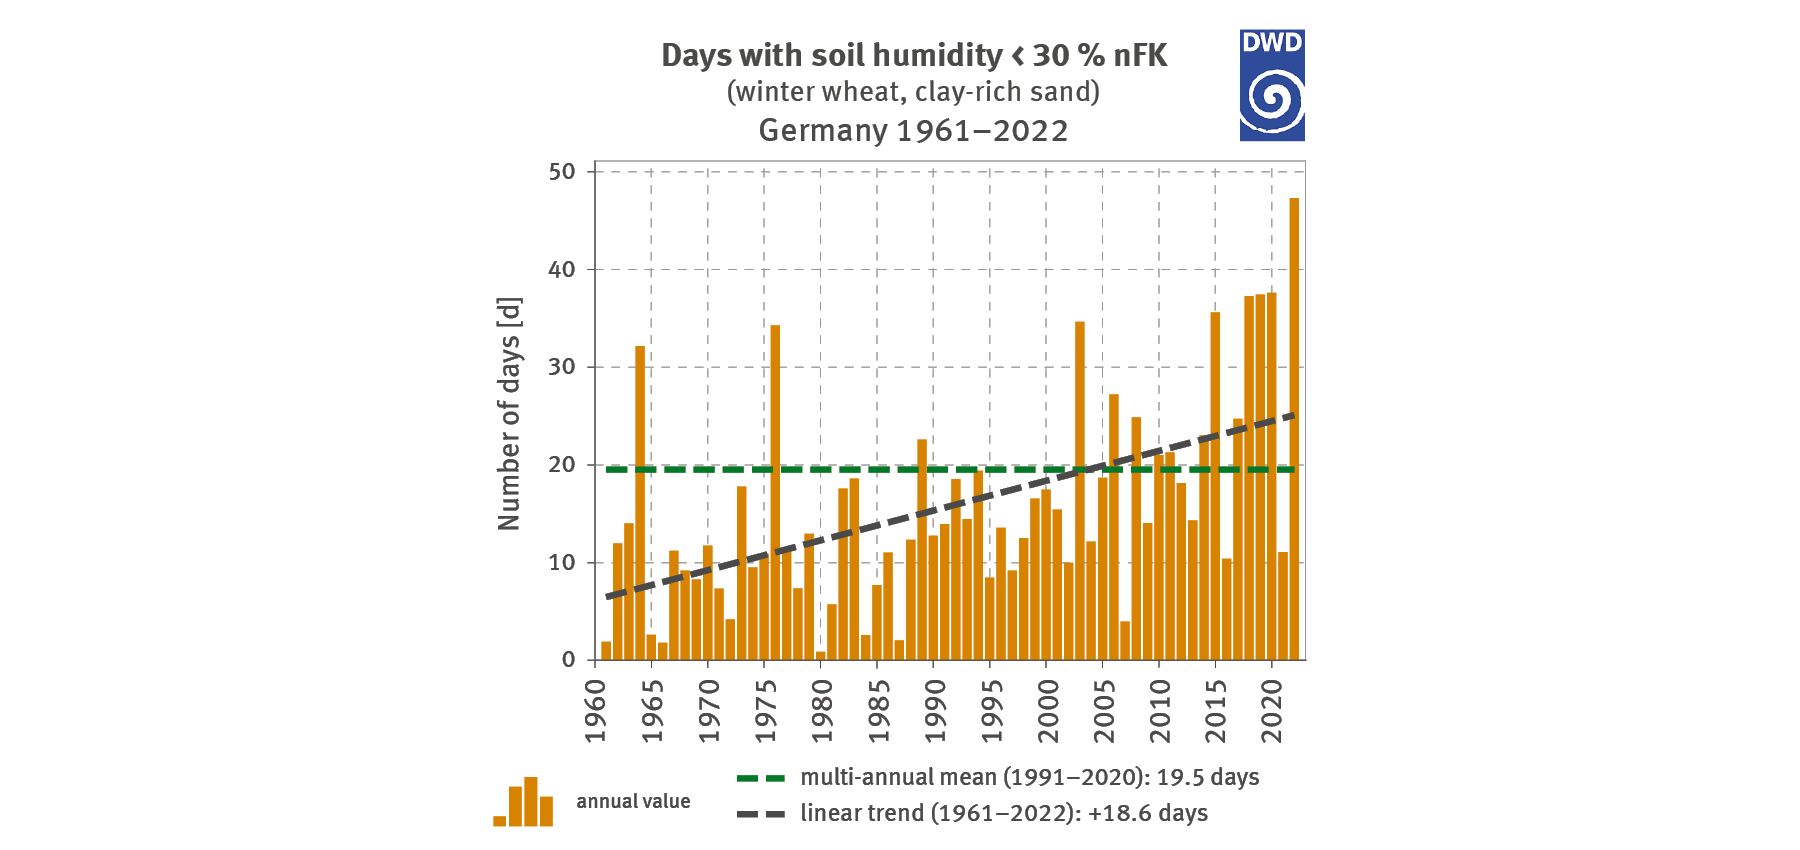
As shown in Figure10 the mean number of days with soil humidity values of less than 30 % nFK has increased significantly in Germany since 1961, both for heavy soil (left) and for light soil (right). Owing to the lower water storage capacity of light soil, the number of days on which the critical threshold value is not reached is generally greater for light soil than for heavy soil. However, for the development of or the damage to plants, the duration of such days with an nFK value of less than 30 % plays an important role. Furthermore, it must be remembered that extended droughts during the main growth period affect the development of plants and yields significantly – more than, for instance, a brief drought just before harvest.
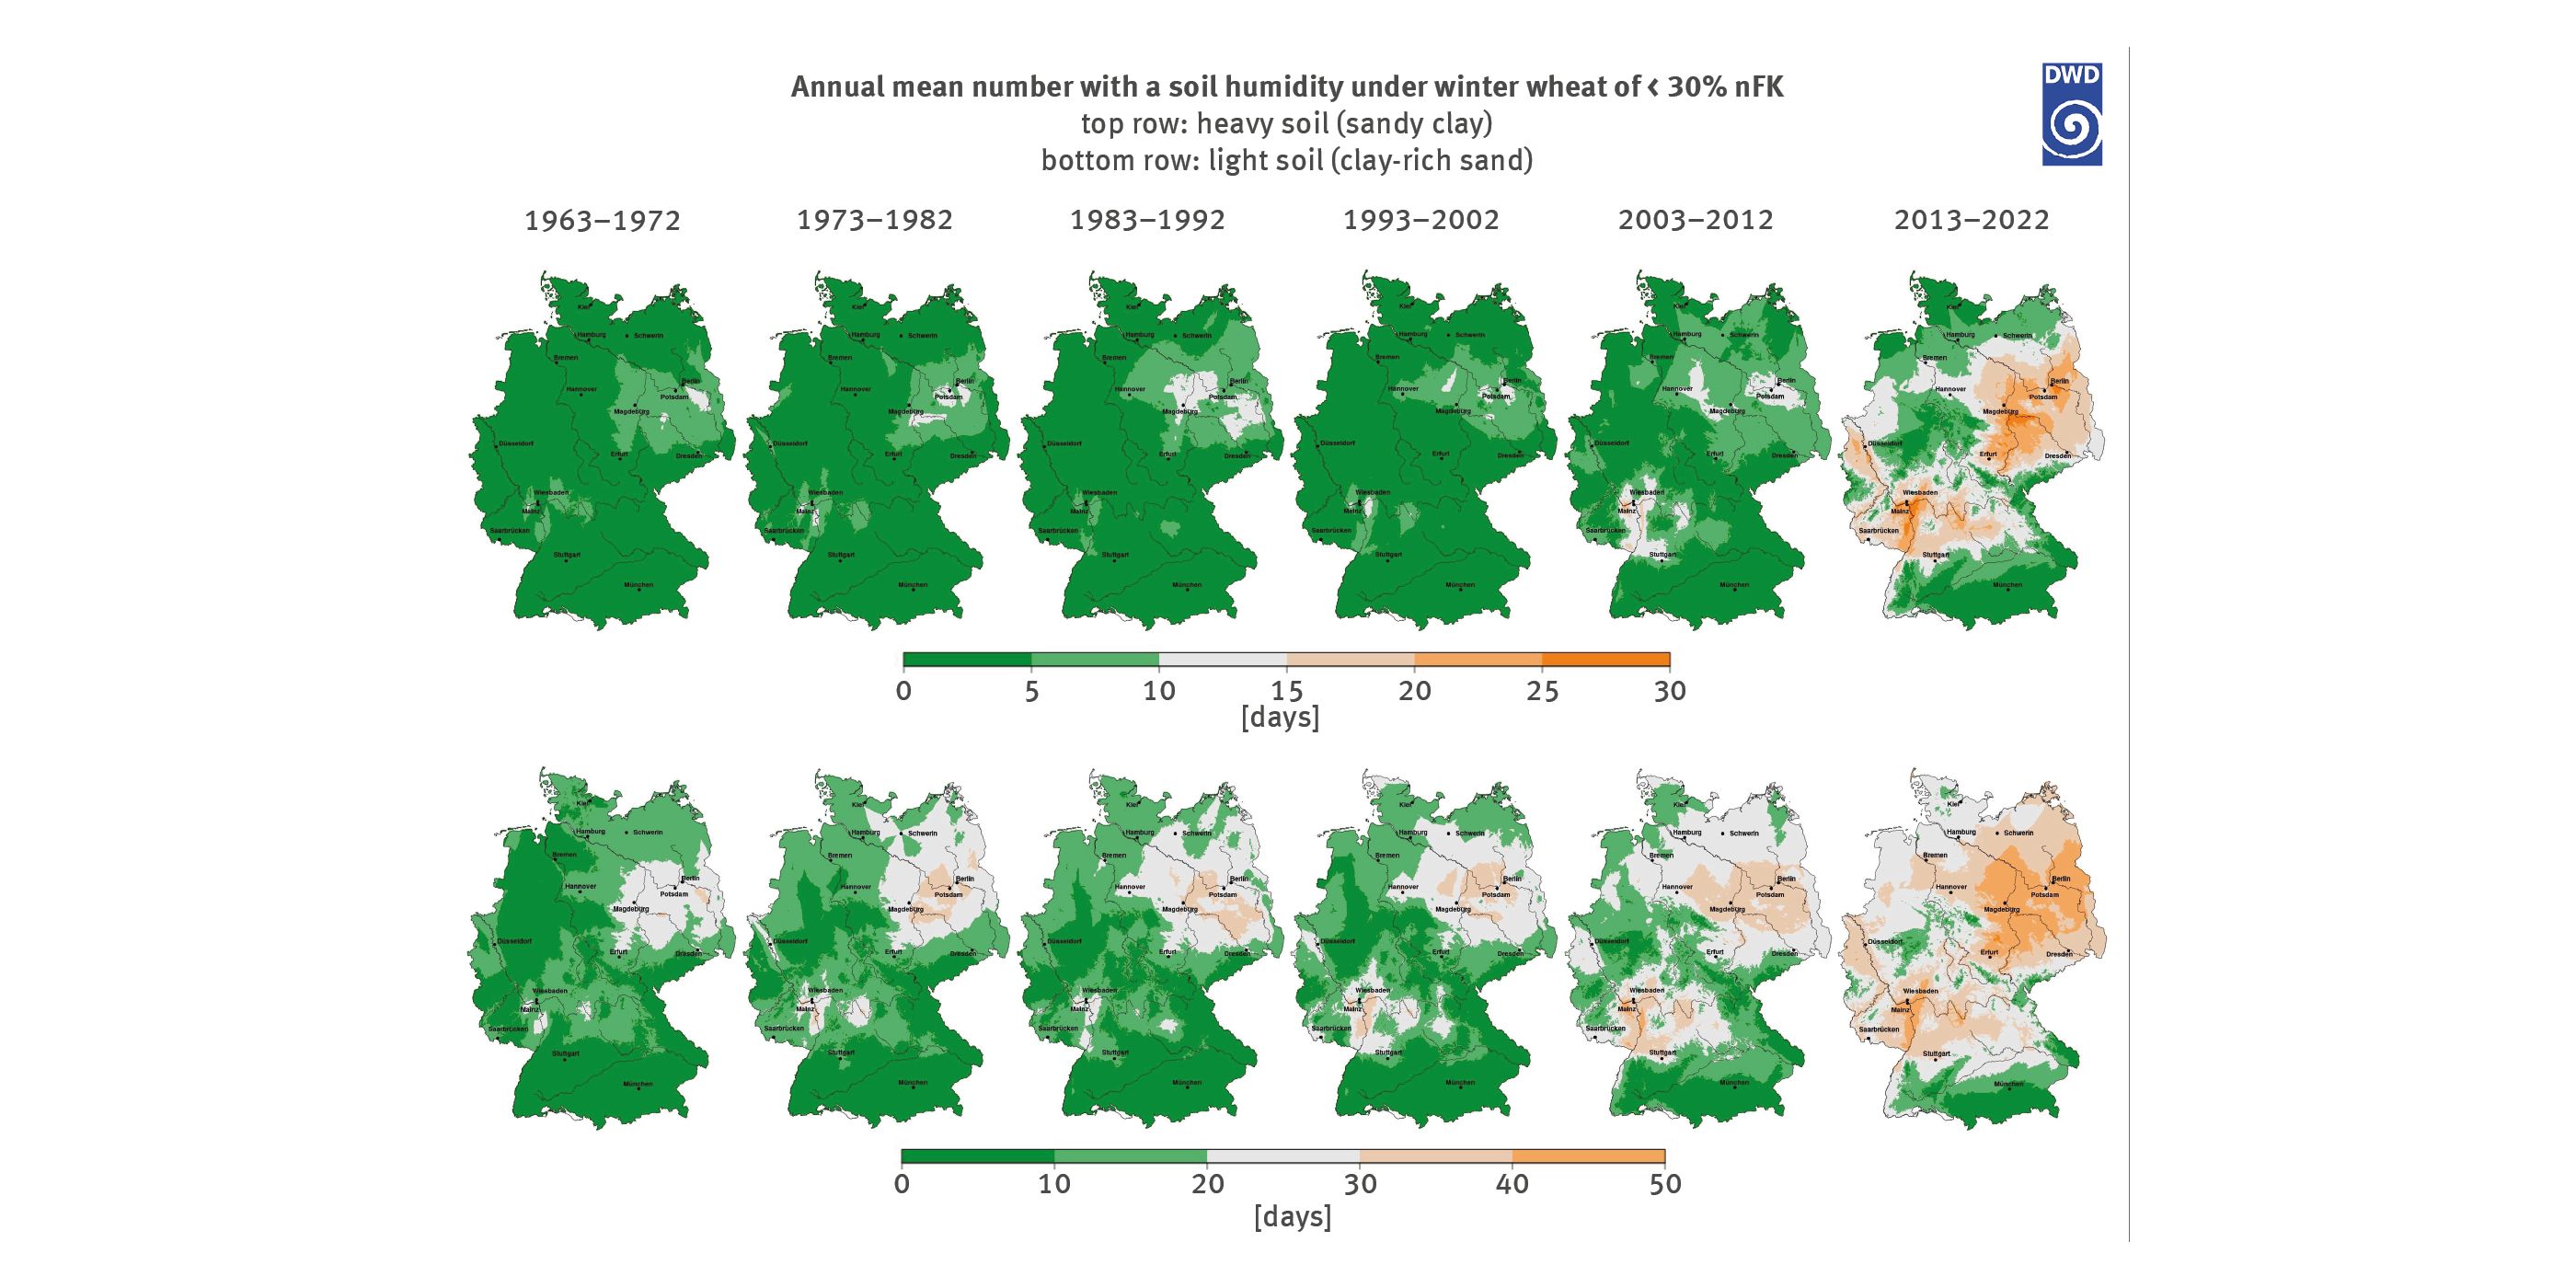
Widespread areas in eastern Germany and the Rhine-Main area are particularly affected by increasingly dry soil (see Fig. 11).
The chart consists of two illustrations – one showing the number of days with soil humidity of less than 30 per cent usable field capacity (nFK) for winter wheat on sandy clay while the other shows – for the same number of days – the comparable value for winter wheat on clay-rich sand, each for the period of 1961 to 2022. The multi-annual mean for the period of 1991 to 2020 for sandy clay amounts to 5.3 days. The linear trend for Germany regarding the period examined amounts to an increase by 8.6 days. The height of the bars increases, albeit with annual fluctuations. Most of the values vary between 0 and 5 days, while peak values lie above 20 days, and the only value above 25 days was recorded for 2022. The multi-annual mean from 1991 to 2022 for clay-rich sand amounts to 19.5 days. The linear trend for Germany regarding the period examined amounts to an increase by 18.6 days. The height of the bars increases, albeit with annual fluctuations. Most of the values vary between 0 and 20 days, while peak values lie above 20 days, and the only value above 40 days was recorded in 2022.
Source: DWD
Figure 10: Soil moisture values - clay-rich sand
The chart consists of two illustrations – one showing the number of days with soil humidity of less than 30 per cent usable field capacity (nFK) for winter wheat on sandy clay while the other shows – for the same number of days – the comparable value for winter wheat on clay-rich sand, each for the period of 1961 to 2022. The multi-annual mean for the period of 1991 to 2020 for sandy clay amounts to 5.3 days. The linear trend for Germany regarding the period examined amounts to an increase by 8.6 days. The height of the bars increases, albeit with annual fluctuations. Most of the values vary between 0 and 5 days, while peak values lie above 20 days, and the only value above 25 days was recorded for 2022. The multi-annual mean from 1991 to 2022 for clay-rich sand amounts to 19.5 days. The linear trend for Germany regarding the period examined amounts to an increase by 18.6 days. The height of the bars increases, albeit with annual fluctuations. Most of the values vary between 0 and 20 days, while peak values lie above 20 days, and the only value above 40 days was recorded in 2022.
Source: DWD
Figure 11: Annual mean number of days with a soil humidity
The chart consists of two rows of six nationwide maps each of Germany. The top row of maps shows the annual mean number of days with a soil humidity of less than 30 per cent usable field capacity for winter wheat on sandy clay, while the number of days in the bottom row refers to clay-rich sand. The six maps each cover the following periods: 1963–1972, 1973–1982, 1983–1992, 1993–2002, 2003–2012 and 2013–2022. The range for the top row is spread over 5 equidistant categories from 0 days (in shades of green) to the maximum of 30 days (in shades of orange). For the bottom row the range is spread over 5 equidistant categories from 0 to 50 days. Looking towards the right, the maps are increasingly dominated by shades of orange. There is a distinct focal area in the north-eastern part of Germany, and in later years, also in the Rhine area between Stuttgart and Frankfurt. In the bottom row of maps, the orange-coloured areas on the most recent map extend to almost the whole of Germany, except for the south of Bavaria and Baden-Württemberg, the Bavarian/Upper Palatinate forest, the Fichtel Mountains and the Erz Mountains on Germany’s eastern border as well as the western uplands where the areas are still coloured green.
Any statements on the future development of meteorological parameters are made on the basis of climate projections. The potential climate change is calculated by a global climate model based on a scenario. Two scenarios are examined in this report. The ‘Climate protection scenario’ (RCP 2.6) is based on assumptions in line with the global 2-degrees upper limit. The aim is to achieve a situation where in 2100 the world will be subject to global warming of no more than 2 °C compared to the pre-industrial level. The ‘High emissions scenario’ (RCP 8.5) describes a world in which energy supply is essentially based on the burning of carbon-rich fossil fuel reserves. Compared to today, the emission of greenhouse gases will increase further steadily by 2100 in line with the radiative force.
It would be incorrect to equate a climate projection to a climate forecast. In fact, it is a ‘what if’ calculation based on the scenario selected. Climate projections are useful for trying to categorise different scenarios within a bandwidth of potential developments while taking into account different climate protection measures.
Global climate projections are used as drivers for regional climate projections. The analyses shown are based on the outcomes of 32 regional climate projections covering a period from 1971 to 2100 (climate ensemble). The regional climate projections used constitute the DWD Reference Ensemble which was ‘regionalised’ within the framework of research into a theme entitled ‘Climate change and adaptation’ by the experts network of the Federal Ministry for Digital and Transport (BMDV); it was bias-adjusted (in other words, adjusted for a reduction in systematic errors) and applied to a 5 kilometre grid8. The assessments listed below are all based on this ensemble. In order to calculate the difference between the present and the future state, two 30-year periods were used, and a mean value was calculated for each period. The years from 1971 to 2000 covered in the model calculations were used as reference period for the climate examined. Furthermore, in order to optimise categorisation, Figure 12 (right-hand side) shows – in respect of temperature – the change in relation to the early industrial period of 1881 to 1910. Two periods were analysed in terms of the future: The short-term planning horizon describes the mean value of the years from 2031 to 2060. The years from 2071 to 2100 are used as a basis for the long-term planning horizon. Future changes are stated in terms of a bandwidth. The description of the bandwidth is based on the values of the 15th and 85th percentile contained in extant datasets. This approach makes it possible to eliminate any outliers at either end of the ensembles from climate projections.
Temperature - mean values and extremes in the future
The temperature change that has been reached already – between the early industrialisation period and the reference period of 1971 to 2000 – amounts to 0.8 °C. In Germany, a further temperature increase is to be expected.
For the short-term planning horizon (2031–2060) the increase amounts to 0.8 to 1.5 °C approximately in the climate protection scenario and to 1.5 to 2.3 °C in the high emissions scenario (see Fig. 12). So far, the development has not been very dependent on the emissions scenario. The warming process is more pronounced in the south of Germany. The temperature development for the long-term planning horizon (2071–2100) is characterised strongly by the scenario selected. Based on the climate protection scenario, an increase by 0.9 to 1.6 °C is to be expected. There are hardly any regional differences. Under the conditions of the high emissions scenario, warming amounts to 3.0 to 4.7 °C approximately. The warming process is more pronounced in the south of Germany. The extent of warming is similar in the various seasons, except for spring when it is less pronounced.
The future increase in temperature entails a distinctive change in temperature extremes. Extreme conditions linked to low temperatures are decreasing markedly, whereas those linked to warmth are increasing strongly. This development also increases the frequency of heatwaves. The climate projections suggest a distinct change in all indicators, especially in terms of the high emissions scenario and the long-term planning horizon. In most regions, a distinct increase is expected in terms of summer days, hot days and tropical nights. As far as the mean value for Germany is concerned, regarding the short-term planning horizon, the high emissions scenario suggests between 5 and 10 additional hot days annually, and regarding the long-term horizon, between 14 and 28 days. In future, tropical nights will occur also in regions where they have not occurred before. In particular for the high emissions scenario, a distinct increase in frequency and an expansion to new areas are to be expected. As far as the mean value for Germany is concerned, in this scenario, for the short-term planning horizon, an increase by up to 3 tropical nights annually is to be expected, compared to the long-term planning horizon where an increase by 5 to 16 tropical nights is to be expected. In the Upper Rhine Rift Valley and in urban agglomerations, the greatest increase in tropical nights is to be expected. By contrast, the number of frost and ice days – as in the past few decades – will decrease further in all regions. Especially in the river valleys of Ruhr and Rhine, ice days will occur only very rarely. However, less drastic changes are to be expected for the short-term planning horizon and for the climate protection scenario.
Figure 12: Range of the change signal in extant climate projections for the annual mean temperature
The chart consists of two illustrations: one for the climate protection scenario RCP 2.6 and the other for the high emissions scenario RCP 8.5 indicating the range of the projected change in the annual mean temperature in Germany compared to a specific reference period. The illustration on the left shows the change compared to the multi-annual temperature mean of the period from 1971 to 2000. With regard to the climate protection scenario, the annual mean temperature for the period from 2031 to 2060 will be by approximately 0.8 to 1.7 degrees Celsius higher than the reference value. In the period from 2071 to 2100, the deviation from the reference value will be on a similar scale. In case of the high emissions scenario it is expected that in the period from 2031 to 2060, the temperature will rise by 1.5 to 2.4 °C compared to the multi-annual mean of the period from 1971 to 2000. For the period from 2071 to 2100 in this scenario, it is projected that the annual mean temperature will increase by 2.9 to just under 5 °C. The illustration on the right shows the change compared to the multi-annual temperature mean of the period from 1881 to 1910. In both scenarios examined, the increase is higher than in the left-hand chart. In the case of the climate protection scenario, the annual mean temperature for the period from 2031 to 2060, compared to the multi-annual mean temperature of the period from 1881 to 1910, will be by approximately 1.5 to 2.3 degrees Celsius higher. In the period from 2071 to 2100, the deviation from the reference value will be on a similar scale. In the case of the high emissions scenario, it is expected that in the period from 2031 to 2060, the temperature will rise by 2.1 to 3.2 °C compared to the reference value. For the period from 2071 to 2100 in the high emissions scenario, it is projected that the annual mean temperature will increase by between 3.7 and just under 5.5 °C.
Source: DWD
Precipitation - mean values and extremes in the future
For the short-term planning horizon 2031–2060, there is no distinct change projected with regard to the annual precipitation total. For the annual mean precipitation a change by ±0 % to +6 % was calculated regarding the climate protection scenario and by -1 % to +9 % for the high emissions scenario (see Fig.13). The difference between the two scenarios is minor, while the change is roughly the same for the entire Federal Republic. In principle, it must be said that a modelled change of less than 10 % is not distinguishable from natural climate variability. This threshold value applies equally to all subsequent values. For the long-term planning horizon of 2071–2100 in Germany, with regard to the high emissions scenario, a change in the annual mean precipitation is to be expected in the range of ±0 % to +16 %. The change is expected to be about the same in all parts of the Federal Republic.
For the short-term planning horizon 2031–2060, using the climate protection scenario for winter, the increases calculated amount to between +3 % and 11 % compared to between +2 % and 23 % in the high emissions scenario. It is not possible to make a resilient statement regarding the trend direction for summer and autumn. The range of outcomes for summer lies between -6 % and +3 % (climate protection scenario) and between -7 % and +7 % (high emissions scenario). In autumn the range lies between -4 % and +5 % (climate protection scenario) and between -7 % and +10 % (high emissions scenario). In spring there are changes indicated for this planning horizon in the mean precipitation total – assuming a climate protection scenario ranging from +3 % to +12 %. On the basis of the high emissions scenario, an increase between +6 % and +14 % was calculated.
In spring, the change on the basis of the long-term planning horizon (2071–2100) can – depending on the type of scenario – amount to +0 % to +11 % (climate protection scenario) or +3 % to +22 % (high emissions scenario), whilst in autumn the comparable values are -3 % to +7 % (climate protection scenario) or -7 % to +18 % (high emissions scenario). In winter the change can lie between +7 % and +33 % (high emissions scenario) and between -3 % and +13 % (climate protection scenario). For the summer within this planning horizon, values ranging from a very small change in the climate protection scenario (-6 % to +3 %) were calculated, while a potential decrease in precipitation was calculated for the high emissions scenario with values ranging from -14 % to +6 %. In the individual regions, summer is also characterised by wide-ranging outcomes which appear not sufficiently resilient.
As far as the change in the number of days with precipitation of at least 20 mm per day is concerned, an increase is expected for all regions, both within the short-term and the long-term horizon. For the alpine region only, some models project a decrease in the number of days. In this context, the most distinctive increase is projected for spring and winter. In the short-term planning horizon, the difference between the individual climate scenarios is rather minor, whereas in the long-term planning horizon, the difference is more pronounced in winter, spring and autumn. A less pronounced increase is projected for the days with precipitation of 30 mm and more. However, in the case of heavy-rain events, the range within the ensemble is very extensive in some cases, thus making the outcomes lack in resilience. Regional differences regarding the change in the annual mean total of precipitation are not very pronounced.
For the projection period the assumption is that for the whole year, dependent on the bandwidth of the climate model ensemble and the climate scenario, changes ranging from a minor decrease up to a moderate increase in dry days can be expected. However, as far as the individual seasons are concerned, projections are more differentiated. While there is no appreciable change in respect of dry days within the short or the long-term planning horizon regarding the climate protection scenario in winter and spring, there is a moderate increase expected for summer and autumn, although there are no major differences between the short or long-term horizons, Within the high emissions scenario there are no projections for major change either, as far as winter and spring are concerned. However, especially in summer, a distinct increase in dry days is projected for the distant future although this is projected to be more moderate in the autumn season.
Figure 13: Spectrum of the change signal in extant climate projections for the annual precipitation
The chart shows the projected range of change in the annual precipitation total for the periods from 2031 to 2060 and 2071 to 2100 in relation to the multi-annual mean of the years from 1971 to 2000 in per cent. In this context, consideration is given to the climate protection scenario RCP 2.6 on one hand and the high emissions scenario RCP 8.5 on the other. Within the climate protection scenario, the projected change in the annual precipitation total – compared to the mean value of the period from 1971 to 2000 – ranges from –0.5 to 7 per cent in the period of 2031 to 2060, and from –2.5 to 5 per cent in the period of 2071 to 2100. Within the high emissions scenario, the projected change in the annual precipitation total – compared to the mean value for the period of 1971 to 2000 – ranges from -1 to just under 10 per cent in the period of 2031 to 2060 and from 0 to 16.5 per cent in the period of 2071 to 2100.
Source: DWD
6 - IPCC – Intergovernmental Panel on Climate Change 2021: Summary for Policymakers. In: Climate Change 2021: The Physical Science Basis. Contribution of Working Group I to the Sixth Assessment Report of the Intergovernmental Panel on Climate Change [Masson-Delmotte, V., P. Zhai, A. Pirani, S.L. Connors, C. Péan, S. Berger, N. Caud, Y. Chen, L. Goldfarb, M.I. Gomis, M. Huang, K. Leitzell, E. Lonnoy, J.B.R. Matthews, T.K. Maycock, T. Waterfield, O. Yelekçi, R. Yu, and B. Zhou (eds.)]. Cambridge University Press, Cambridge, United Kingdom and New York, NY, USA, pp. 3−32, doi: 10.1017/9781009157896.001
Lenssen N., Schmidt G., Hansen J., Menne M., Persin A., Ruedy R., Zyss D. 2019: Improvements in the GISTEMP uncertainty model. J. Geophys. Res. Atmos., 124, no. 12: 6307-6326. doi: 10.1029/2018JD029522
8 - Brienen S., Walter A., Brendel C., Fleischer C., Ganske A., Haller M., Helms M., Höpp S., Jensen C., Jochumsen K., Möller J., Krähenmann S., Nilson E., Rauthe M., Razafimaharo C., Rudolph E., Rybka H., Schade N., Stanley K. 2020: Klimawandelbedingte Änderungen in Atmosphäre und Hydrosphäre: Schlussbericht des Schwerpunktthemas Szenarienbildung (SP-101) im Themenfeld 1 des BMVI-Expertennetzwerks. 157 pp. doi: 10.5675/ExpNBS2020.2020.02
The UBA’s motto, For our environment (“Für Mensch und Umwelt”), sums up our mission pretty well, we feel. In this video we give an insight into our work.
The UBA
Contact
Wörlitzer Platz 1 06844 Dessau-Roßlau GermanyPlease send us your enquiries exclusively via the contact form.
Due to the large number of enquiries, there may be delays in responding. We ask for your understanding.