BO-I-4: Temperature in the topsoil
 Click to enlarge
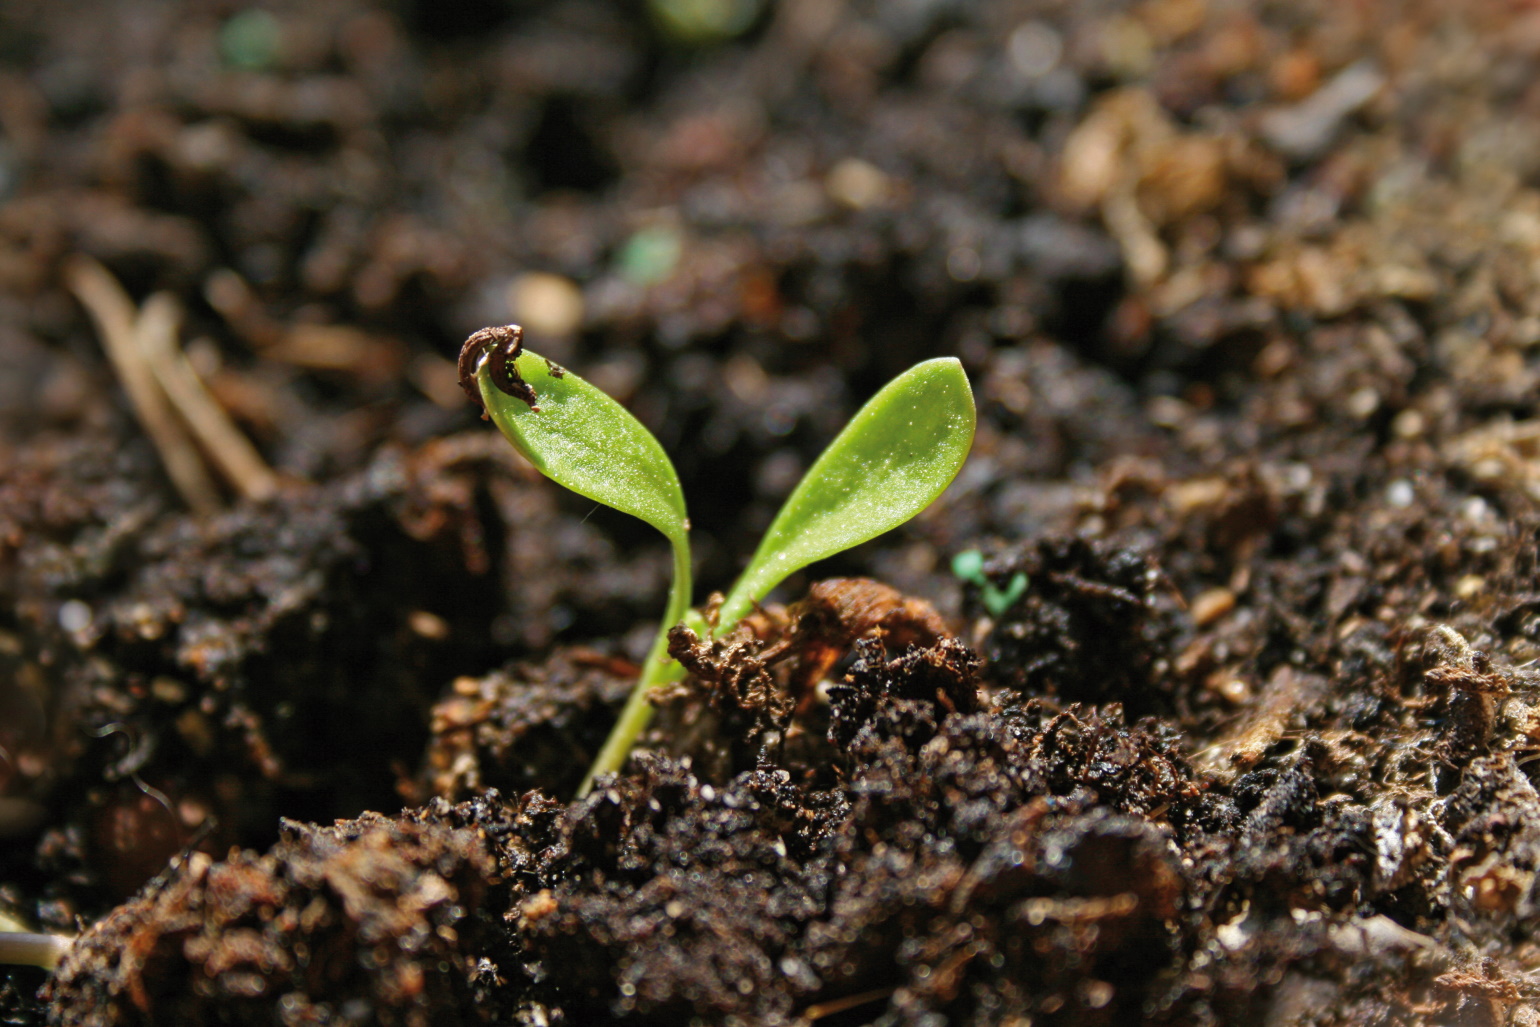
Source: sandra zuerlein / stock.adobe.com
2023 Monitoring Report on the German Strategy for Adaptation to Climate Change
Click to enlarge2023 Monitoring Report on the German Strategy for Adaptation to Climate Change
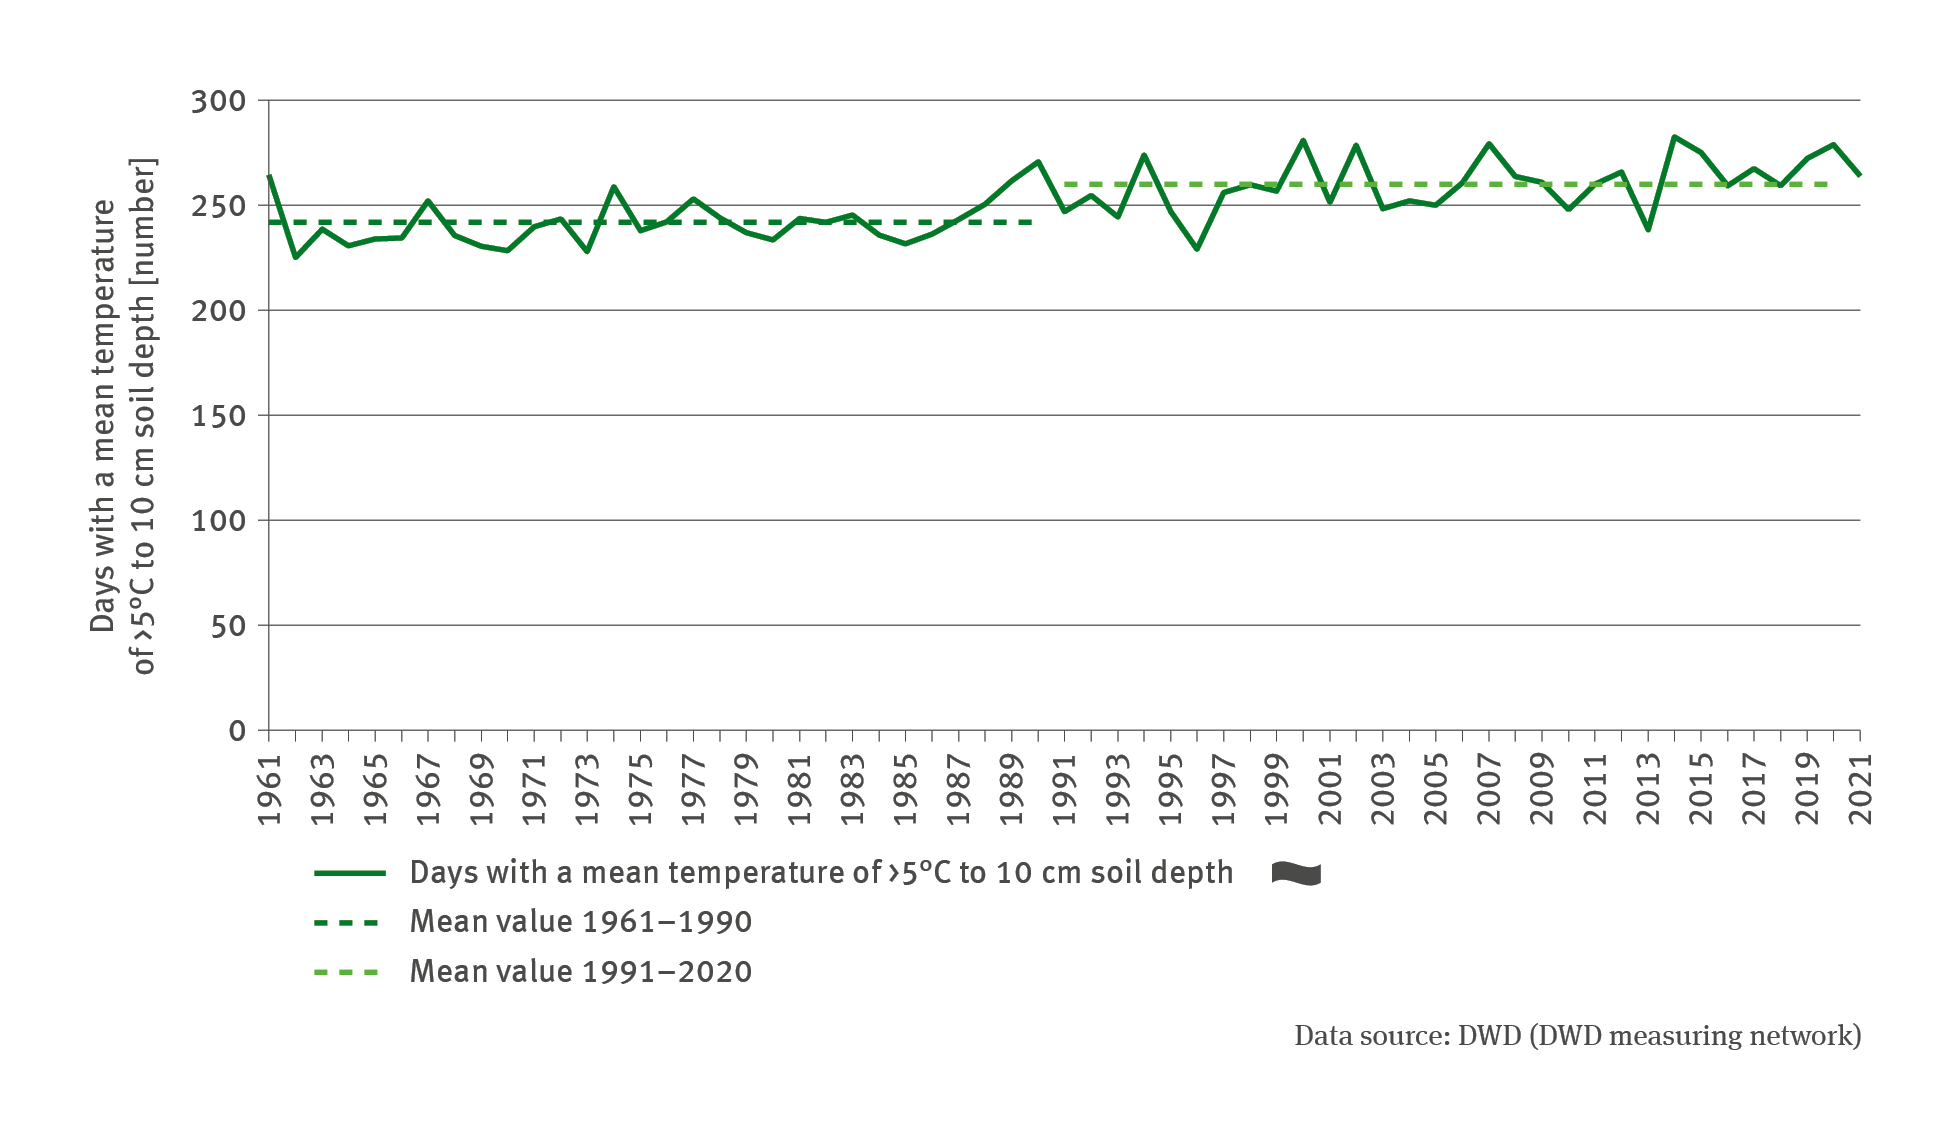
At a soil temperature of greater than 5 °C in the topsoil (daily mean), the nutrient mobilisation and the development of most plant species set in, whereas at 5 °C and less, these processes revert to a standstill. The number of days with a soil temperature greater than 5 °C has increased significantly over the past 60 years. In particular, an early onset of a warm spring and a warm autumn, lead to high indicator values.
In the same way as air temperature, soil temperature is rising too. This scenario has effects on the chemical and biological processes in the soil and on soil development. The chemical weathering of rock is accelerated at high temperatures, because the temperature influences the speed of reactions as well as the chemical solution equilibria. The decomposition of organic matter also accelerates because soil organisms are more active as a result.
Furthermore, the soil temperature is a major factor in determining the length of the growth period and the mobilisation of nutrients in the soil. Whenever a daily mean temperature of 5 °C in the topsoil is exceeded – more precisely, down to a depth of between 5 and 10 centimetres – this will trigger the mobilisation of nutrients and the development of most plant species. Once this temperature threshold is undercut, the development process will come to a standstill. In Germany’s lowlands, soil temperatures of more than 5 °C prevail roughly between the beginning of March until the end of November. There are regional differences depending on altitude and geographical latitude. In the course of a year, values of 5 °C are typically first exceeded in southwest Germany. Subsequently, values of 5 °C and more in the soil gradually begin to be reached also in a north-easterly direction.
A prerequisite for temperature-driven processes in terms of the conversion and displacement of matter is the sufficient supply of water in the soils (cf. Indicators BO-I-1 and BO-I-2). If conditions are too dry, many chemical processes and plant growth are inhibited. The same applies when soils are saturated with water and anaerobic conditions prevail – in other words, when either the concentration of oxygen is too low or there is none at all.
Given that soil temperature is directly dependent on sun irradiation, soil temperature usually moves in line with the daily or annual course of the radiation regime, albeit with certain temporal delays. It must be noted, however, that there can be major differences between air temperature and soil temperature. For instance, in comparatively dry conditions – contrary to air – bare soil can heat up more stronglyw. By contrast, moist soils warm up more slowly and can impart a cooling effect to their environment. Owing to their higher reflection capacity, light-coloured soils do not warm up very strongly, whereas in dark-coloured soils, temperatures can rise quickly and strongly. Soils covered with vegetation warm up with some delay, and they also cool off with delay.
The fact that soil temperatures rise in line with climate change also entails impacts on the humus regime (cf. Indicator BO-R-1). A warmer soil temperature can further humus decomposition on account of the resulting high biological activity. This decomposition has adverse effects, not just on the water-storage capacity of soils and their ability to bind nutrients; it also reduces the structural stability of soils, and – given the risk of coinciding (rain-related) erosion – this scenario is problematic (cf. Indicator BO-I-3).
Soil temperature is the foremost driver of soil respiration. An increase in soil respiration can lead to an additional release of CO2 from the soils thus resulting in positive feedback and further accelerating global warming. However, temperature rise can also favour the sequestration of atmospheric carbon in the soil. This is because at higher temperatures with associated longer growth periods, plants produce more biomass by absorbing CO2 from the atmosphere – provided there is adequate availability of water. As a result, more carbon is sequestered in the soil. In this way – contrary to the humus decomposition outlined above – it is possible for humus enrichment to occur. These complex – and in some respects counteractive – developments demonstrate that a change in soil temperature per se is not a suitable basis for drawing straightforward conclusions in respect of potential changes in soil processes.
The measuring data underlying the indicator emanate from standardised measuring fields operated by DWD. These fields are continuously kept free of vegetation. It is therefore not possible to apply or transfer these measuring results directly to soil conditions prevailing on land in agricultural use or even to forest soils. The indicator illustrates the number of days on which the threshold of 5 °C of the daily mean temperature in topsoil was exceeded. The nationwide value represents the mean of measurements recorded at 15 stations spread geographically across Germany. In the course of the past 60 years, this nationwide mean has increased significantly. While the mean of the years 1961 to 1990 amounted to 242 days with greater than 5 °C, the mean for the period of 1990 to 2020 amounted to 260 days already. However, there is no statistical change point in the time series. The increase proceeded relatively continuously. However, the values clearly fluctuated from year to year. High values occurred above all in cases when autumn remained warm and dry for a long time (cf. Indicator BD-I-1) and the warmth was retained in the soil for a lengthy period. High air temperature in summer is of no consequence regarding the course of the indicator. This is demonstrated by the year of 2018. In that year, the highest mean air temperature to date was recorded – a value of 10.5 °C. However, the number of days with a soil temperature mean of greater than 5 °C, amounting to 259 days, was comparatively low. This is due to the fact that the winter of 2017 / 2018 was characterised by comparatively high precipitation levels. In other words, the soils started out with high water contents in spring and consequently required a long time to warm up. By contrast, the year of 2020 produced distinctly higher indicator values. Although the mean value for winter 2019 / 2020 in Germany was also very wet, it was nevertheless the second-warmest winter since records began in 1881. That winter was followed by an extremely sunny spring which was far too dry. This, in turn, led to rapid warming of the soil. Consequently, the number of days with a soil temperature mean of greater than 5 °C was only higher by 20 days compared to 2018.
As far as the planning of agricultural management is concerned, the warming of the soil in spring is of major importance, as it is a crucial factor for scheduling the optimal point in time when to sow / drill summer crops (cf. Indicator LW-R-1).
The UBA’s motto, For our environment (“Für Mensch und Umwelt”), sums up our mission pretty well, we feel. In this video we give an insight into our work.
Unfortunately, we are currently not available by telephone.There may currently be delays in answering enquiries. We ask for your understanding.
