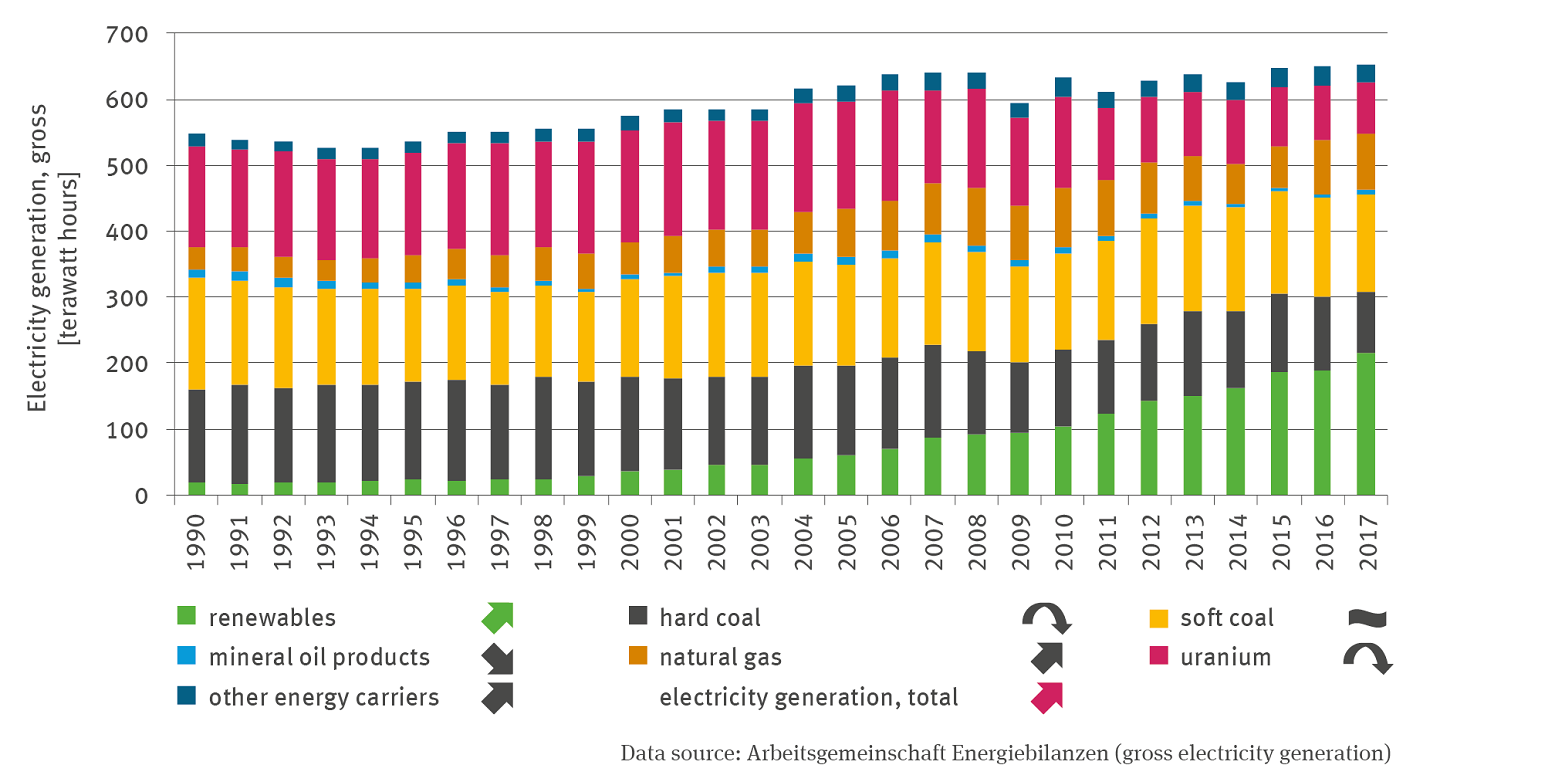
The stack column diagram shows electricity generation (gross) in terrawatt hours in a time series from 1990 to 2017. The sum of electricity generation is significantly increasing. In 2017, it amounted to 654 terawatt hours. The presentation is differentiated for renewables (rising trend), hard coal (quadratic decreasing trend), lignite (no trend), petroleum products (falling trend), natural gas (rising trend), uranium (quadratic decreasing trend) and other energy sources (rising trend). Renewables are increasing particularly significantly. They reached 216 terawatt hours in 2017 and thus had the highest share in absolute terms.
