Maps are created/updated using CL data from the NFC. read more
Air
Maps and CCE Data

Maps are created/updated using CL data from the NFC. read more

Reactive nitrogen, unlike nonreactive molecular nitrogen (N2), is in a great many organic and inorganic substance compounds and of vital importance to all life processes. The availability of reactive nitrogen often limits plant growth, which is why sufficient supply of reactive nitrogen is so important in food production. If excessive amounts of reactive nitrogen are deposited to the environment,... read more
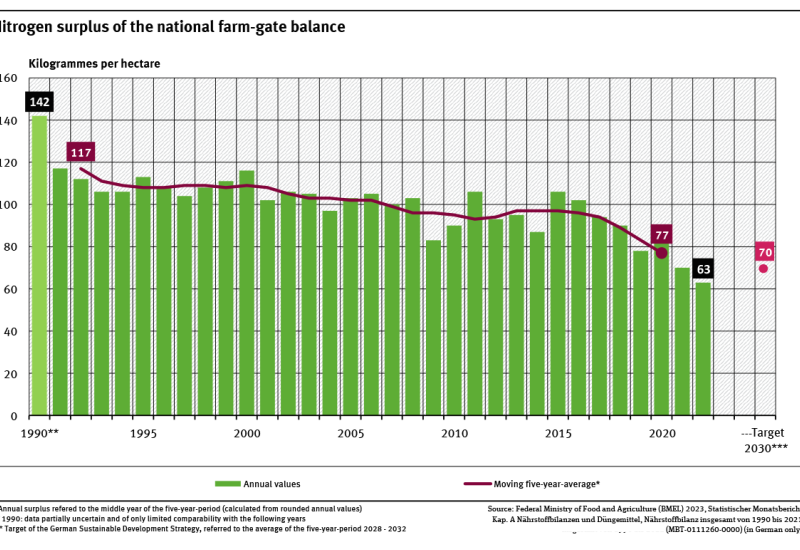
The five-year average of nitrogen surplus of the total balance per hectare of utilized agricultural land has decreased by 34 % since 1992.The Federal Government aims to reduce the average nitrogen surplus of the total balance of the years 2028 to 2032 to 70 kilogrammes per hectare of agricultural land.If the trend of the last 10 years continues, the target will be reached. read more

69 % of vulnerable ecosystems in Germany are threatened 2019 by excess nitrogen deposition.With the revised German Sustainable Development Strategy 2016, the Federal Government aims to reduce the proportion of these areas by 35 % until 2030. According to the current calculation basis, this results in a target value of 52 % by 2030.This target is feasible only if efforts to reduce air pollution are... read more

Too high phosphorus concentrations are measured at more than half of all river measurement stations in Germany.The share has declined by around one third since the beginning of the 1980s. Extreme levels of pollution are very rare nowadays.Aim of the Sustainability Strategy is to meet the requirements for good status for phosphorous in all water bodies by 2030 at the latest.This requires a change i... read more

To achieve the objectives for the protection of the marine environment, Germany has committed to comply with maximum concentrations of nitrogen at estuaries.On average for all rivers, these target concentrations are already met for the North Sea, but still exceeded for the Baltic Sea.Some of the North Sea and Baltic Sea tributaries still have very high concentrations.In order to fulfil the objecti... read more

In 2021 no water body of transitional or coastal waters in the North and Baltic Seas achieved good or very good status.According to the European Water Framework Directive, by 2015 and with a deadline extension to 2027 all waters should have achieved at least a good ecological status.The time must now be used to reach the ambitious targets by 2027 at the latest.This will require considerable additi... read more

In 2021 only around 8 % of German streams and rivers were in at least a good ecological status or had at least a good ecological potential.According to the European Water Framework Directive, by 2015 with a time extension to 2027 all rivers must have achieved at least a good ecological status or potential.The time up to 2027 must be used to reach these demanding targets.The measures taken to date... read more
The UBA’s motto, For our environment (“Für Mensch und Umwelt”), sums up our mission pretty well, we feel. In this video we give an insight into our work.
Unfortunately, we are currently not available by telephone.There may currently be delays in answering enquiries. We ask for your understanding.
