Indicator: Environmentally friendly passenger transport
 Click to enlarge
Source: Federal Ministry for Digital and Transport Figure as PDF
Click to enlarge
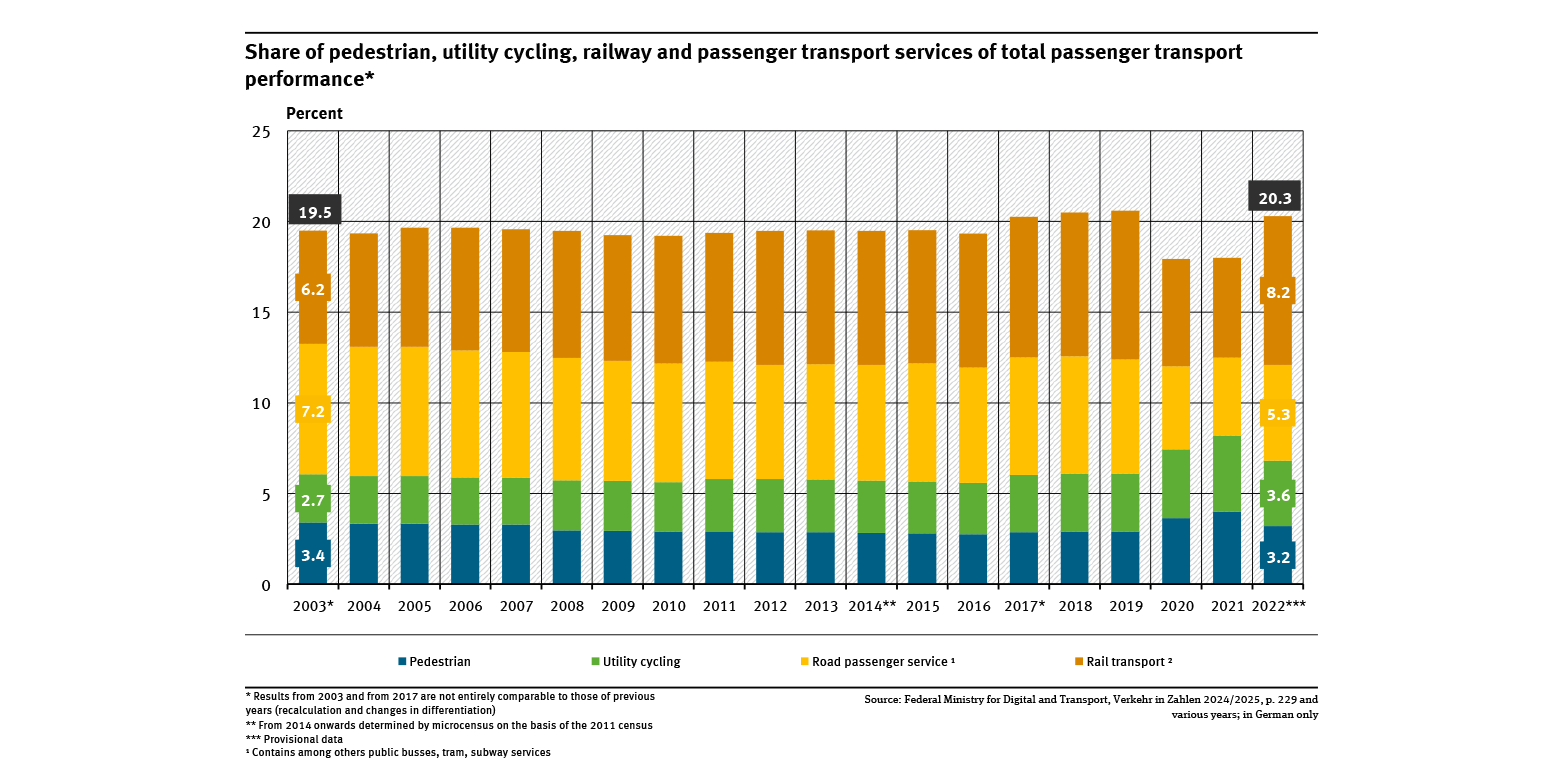
- The share of environmentally friendly passenger transport has remained more or less constant since 2003, only slightly increasing until 2019 and reaching 20.6 %. In 2020 and 2021, it fell to around 18 % due to the pandemic and was back at 20.3 % in 2022.
- To keep the environmental impact of passenger transport low, the share of environmentally friendly transport in total passenger transport should be as high as possible.
- The Federal Government’s National Cycling Plan is to support cycling as a means of transport; a federal strategy for pedestrian traffic was published in February 2025.
Passenger transport has long been dominated by the car, what is known as individual motorised transport (IMT). Car traffic is a heavy burden on the environment through greenhouse gas emissions, air pollution and noise. In addition, stationary as well as moving traffic takes up space. Overall, apart from aviation, public transport modes have a better environmental balance than cars with average occupancy. The use of bus, train, walking and cycling have been summed up under the term ‘Umweltverbund’ or eco-mobility. The indicator shows the share of eco-mobility in passenger kilometres travelled. This share should be as high as possible.
Our mobility is increasing. Between 1976 and 2019, passenger transport almost doubled in Germany, to recently around 1.246 billion passenger kilometres. While in 1976 the share of environmentally friendly transport modes was around 24 %, it has fallen to 20.6 % by 2019.Due to the pandemic in 2020 and 2021, the share decreased to around 18 % and was back at 20.3 % in 2022.
To promote cycling, the Federal Government developed the "National Cycling Plan" (NRVP). The NRVP 3.0 was presented in 2021 and includes key objectives, specific proposals and recommendations for action up to 2030. The NRVP also supports pilot projects at the intersection of cycling and walking. The Federal Ministry for Digital and Transport has also developed a strategy for pedestrian traffic and published it in February 2025.
Ultimately, the traffic performance of the MIV in absolute figures is decisive, as well as the shares of fossil fuels in fuel consumption. This has a significant influence on the development of energy consumption and transport emissions (cf. Greenhouse gas emissions, in German only). Progress so far has not been sufficient.
Official statistics by the Federal Statistical Office of Germany do not actually monitor motorised individual transport, walking or cycling. Instead, the figures are approximated by the German Institute for Economic Research (DIW) using a passenger transport model. This model is based on results of the ‘Mobilität in Deutschland’ (in German only) survey and the 20”” microcensus. A more detailed description of the method can be found in the yearly published ‘Verkehr in Zahlen’ (in German only). It should be noted that a recalculation of the mileage and consumption calculation and the passenger transport model was carried out from 2003 and 2017 onwards, which somewhat limits comparability with previous years.
More detailed information: Fahrleistungen, Verkehrsleistung und Modal Split in Deutschland (in German only).
The UBA’s motto, For our environment (“Für Mensch und Umwelt”), sums up our mission pretty well, we feel. In this video we give an insight into our work.
Unfortunately, we are currently not available by telephone.There may currently be delays in answering enquiries. We ask for your understanding.
